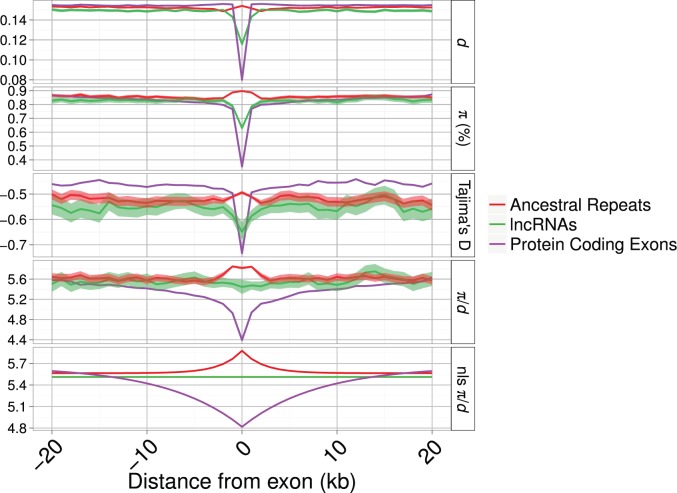
Fig. 4.—
Divergence (d), nucleotide diversity (π), divergence-corrected nucleotide diversity (π/d), and Tajima’s D around focal loci for lncRNAs, excluding “mouse-specific” lncRNAs, known lncRNAs, AR and PC exons. Shaded areas indicate bootstrapped 95% confidence intervals. The panel “nls π/d” shows fitted values from a nonlinear least squares function applied with the parameters described in table 4. The x axis has been limited to 20 kb down and upstream of the focal loci.

