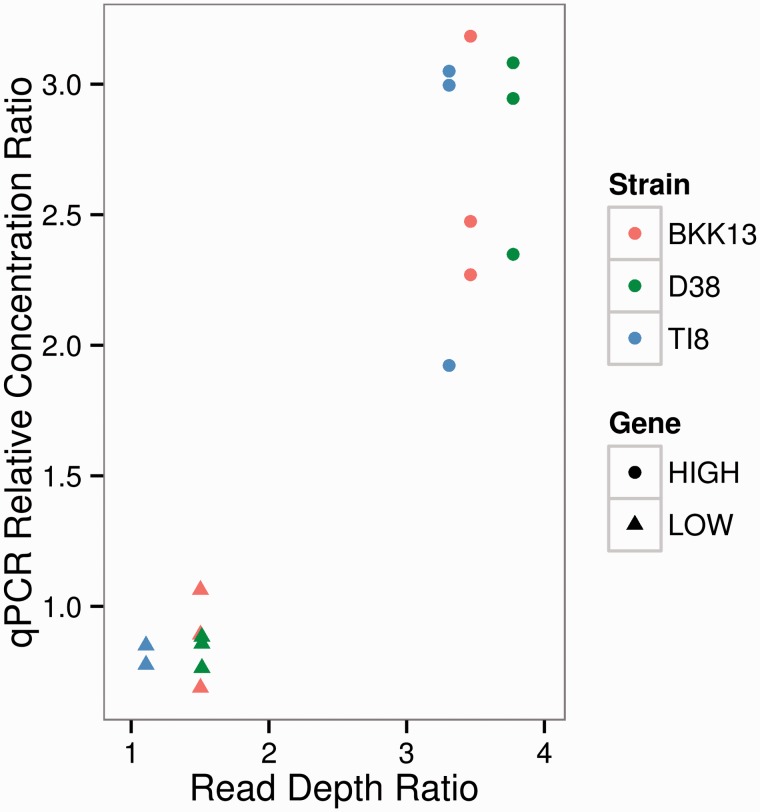
Fig. 4.—
Computational and qPCR estimates of copy number for the LOW and HIGH regions of the wAnaITG genome. Relative copy number of LOW and HIGH region is compared with D. ananassae rp49. The x axis represents read depth of LOW and HIGH region divided by read depth of rp49. The y axis represents relative concentration of LOW and HIGH region divided by relative concentration of rp49.

