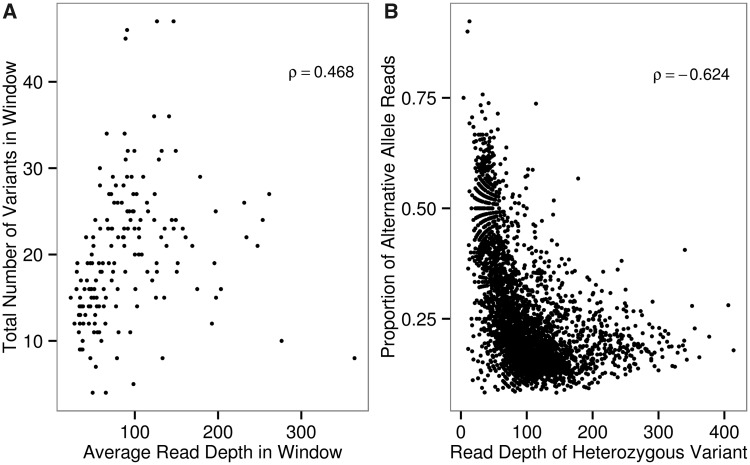
Fig. 7.—
Analysis of sites called as heterozygotes in the wAnaITG genomes. (A) For each wAnaITG genome, a nonoverlapping sliding window analysis of comparing average read depth and the total number of single nucleotide variants. (B) Each data point represents a site called as a heterozygote within a wAnaITG genome, with x axis representing the total read coverage and y axis representing the proportion of alternative alleles consisting the heterozygote variant. Spearman’s rho values are shown in top right corner of each figure and both correlations are highly significant (P < 0.0001).

