Fig. 4.

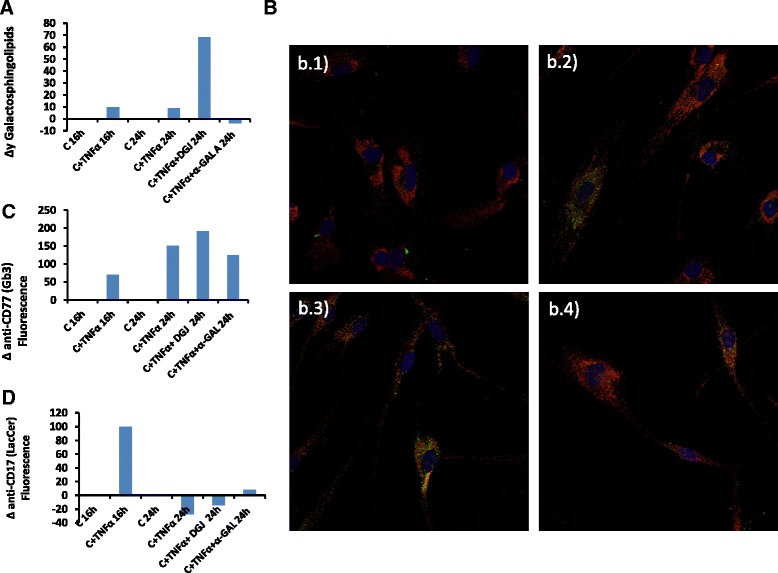
Model of FD substrate accumulation in vitro. a Galactosphingolipid variation rate in wild-type fibroblasts under different conditions. Galactosphingolipids concentration was measured as described (n = 3) and changes in galactosphingolipids levels are represented. b Representative images of in vitro FD model. Control fibroblasts were stained with CD77 (Gb3), green and LAMP1, red. CD77 and LAMP1 merged appear as orange/yellow. Nuclei were stained with DAPI, blue. b.1) Control 24 h; b.2) Control + TNFα 24 h; b.3) Control + TNFα 24 h + DGJ; b.4) Control + TNFα 24 h + agalsidase alfa. c Quantification of CD77/LAMP1 (orange/yellow) fluorescence rate (n = 3). d Quantification of CD17/LAMP1 (orange/yellow) fluorescence rate (n = 3)
