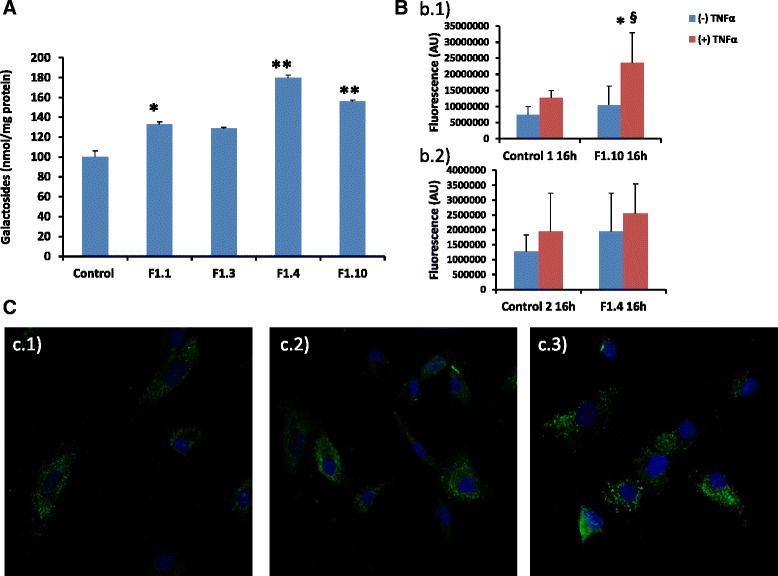
Fig. 5.

Accumulation of galactosphingolipids in fibroblast lysates. a Biochemical quantification after 5 days of culture represented as mean ± SEM. (n = 3) *p ≤ 0.05 **p ≤ 0.001. b Quantification of Gb3 (CD77) confocal images represented as mean ± SD (n = 3) b.1) patient F1.10.*p ≤ 0.05; (+)TNFα vs. (−)TNFα and #p ≤ 0.05; Control vs. F1.10., b.2) Patient F1.4. c Immunocytochemistry of CD77 expression in fibroblasts from c.1) control, c.2) patient F1.4 and c.3) patient F1.10 after 16 h TNFα activation. Nuclei were stained with DAPI, blue
