Abstract
We have previously utilized lumpy object models and simulated imaging systems in conjunction with the ideal observer to compute figures of merit for hardware optimization. In this paper, we describe the development of methods and phantoms necessary to validate or experimentally carry out these optimizations. Our study was conducted on a four-camera small-animal SPECT system that employs interchangeable pinhole plates to operate under a variety of pinhole configurations and magnifications (representing optimizable system parameters). We developed a small-animal phantom capable of producing random backgrounds for each image sequence. The task chosen for the study was the detection of a 2mm diameter sphere within the phantom-generated random background. A total of 138 projection images were used, half of which included the signal. As our observer, we employed the channelized Hotelling observer (CHO) with Laguerre-Gauss channels. The signal-to-noise (SNR) of this observer was used to compare different system configurations. Results indicate agreement between experimental and simulated data with higher detectability rates found for multiple-camera, multiple-pinhole, and high-magnification systems, although it was found that mixtures of magnifications often outperform systems employing a single magnification. This work will serve as a basis for future studies pertaining to system hardware optimization.
1. INTRODUCTION
Researchers in medical imaging are continually striving to improve imaging systems. In many ways, imaging hardware represents the cornerstone of these improvements.1 No matter how refined reconstruction and processing algorithms become, their effectiveness will always depend on the quality of the data given to them; the data gathered by the imaging system itself. Therefore, the optimization of imaging hardware must constitute one of the principal goals in improving an imaging system.
An imaging system maps a continuous object f(r) to a discrete data vector g via the imaging equation
| (1) |
where
 is a continuous-to-discrete (CD) operator representing the imaging system, n is the noise, and bold symbols denote vectors. In this work, different pinhole configurations correspond to different
 operators. Our goal is to objectively determine the best
 (i.e. magnification and pinhole configuration). Note that g is not an image for tomographic systems. Generally, a reconstruction step, represented by the operator
 , is required to produce an image θ, where θ =
 g. Because we are optimizing hardware, we consider only the raw data g and do not account for the reconstruction.
To improve an imaging system, one must first identify a task to be performed and then determine a figure of merit by which to measure the ability of the system to perform that task.1 Tasks are often separated into two types: classification and estimation. In classification tasks, the observer is categorizing an image into one of a finite number of possible outcomes. In the case of two possible outcomes, such as the signal present or signal absent situation considered in this work, the classification task is referred to as a detection. For estimation tasks, the observer is attempting to quantify some particular image parameter, such as tumor size. For detection tasks, the observer is often an ideal observer2 or a human observer.3 An example of a human observer might be a radiologist studying a digital radiogram. Ideal observers are typically computer algorithms designed to maximize task performance as measured by some figure of merit. Ideal observers are useful for optimizing imaging hardware because they act on raw data and not reconstructed or processed images.
Understanding all sources of variability in the imaging system is required for task-based analysis. We consider both detector noise n and variability in the object f(r) being imaged. Each patient (or mouse) varies and this object variability hinders the ability of the observer to perform the task. We directly account for such object variability in this work.
Several previous studies, including some from our group, have striven to optimize hardware configurations through a theoretical, simulation-based approach.2,4,5 In this paper, we endeavor to validate our previously addressed hardware optimization methods by performing imaging studies on physical systems. To this end, we have developed a bead phantom able to produce random backgrounds and a four-camera, small-animal SPECT system capable of operating under a variety of magnification settings and pinhole configurations. We settled upon a detection task and molded a 2mm diameter sphere out of radioactive modeling compound to serve as a signal. This early work will serve as a basis for future studies pertaining to system hardware optimization.
The remainder of the paper is structured as follows. Section 2 serves to describe the methods and hardware developed for the study and the means of data collection. Data analysis and results, including figure of merit criteria, are presented in Section 3. The final section presents a discussion of the results and conclusions.
2. METHODS
2.1. System
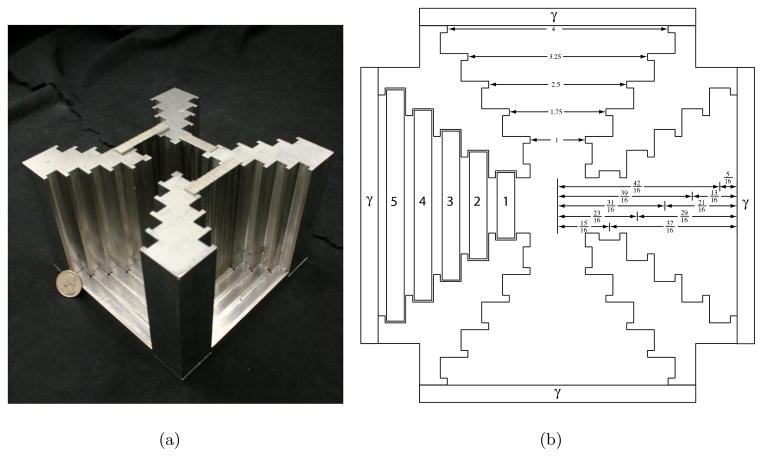
To experimentally study a variety of hardware configurations, we required a four-camera SPECT imaging system capable of operating at several different magnifications and with nearly any desired pinhole structure. To meet these needs, we designed and built a Cerrobend* structure — dubbed the multi-module, multi-resolution SPECT imaging system or M3R — that allows for interchangeable pinhole plates. There are five pinhole plate slots for each camera, providing for either magnification or minification depending on plate selection as shown in Figures 1(a) and 1(b). The size and number of pinholes also depend on plate selection. Varying magnification and/or pinhole configuration is as simple as swapping pinhole plates. There is a central area able to accommodate a small mouse or a phantom such as the cylindrical bead phantom described above. A rotary stage situated beneath the structure allows for object rotation.
Figure 1.
(a) A photograph of the Multi-Module, Multi-Resolution SPECT Imaging System or M3R. As shown, three pinhole plates are present with one in the highest magnification position (m = 3.33) and two in the second-highest magnification position (m = 1.6). The lid has been removed and a quarter used to demonstrate scale. (b) A top-view schematic of M3R. The numbered segments represent pinhole plates inserted into the appropriate slots. The γ segment at the outside of each of the four ports indicates the location of the cameras. All other numbers indicate system dimensions. The object is placed on a rotary stage in the center of the system.
Four Alpha Spectra scintillation cameras were used in the study. Each had a 4.5″ square, 5mm thick sodium iodide crystal, 15mm thick light guide, and nine photomultiplier (PMT) tubes. Each camera is individually housed in lead and aluminum shielding and abuts one port on M3R as shown in Figure 2. M3R was designed so that all parts are nested, creating a light-tight enclosure (with the exception of access holes in the top and bottom of the structure). As a result, background count rates typically hover around 20 counts per second. Although only raw projection data was used for this study, the system is fully capable of generating reconstructed images and could serve as an inexpensive SPECT system.
Figure 2.
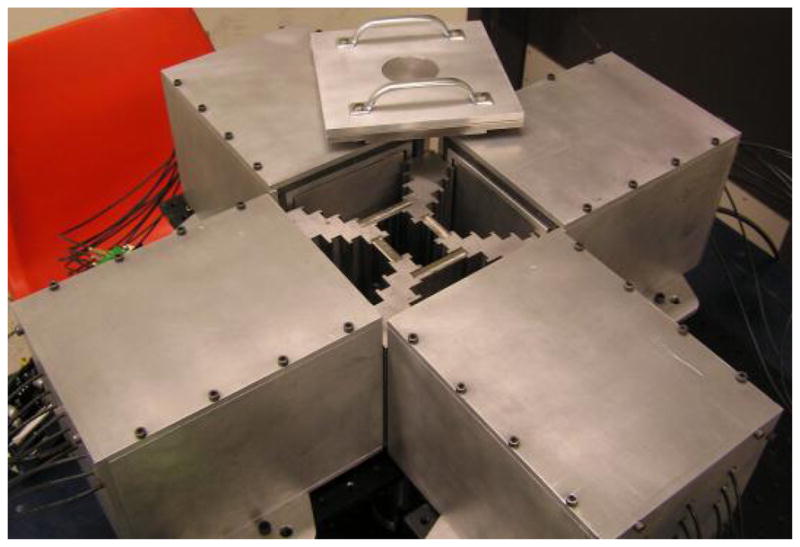
M3R with scintillation cameras in place and the lid removed. Each camera is individually shielded with lead. As shown, two plates are in the highest magnification position (m = 3.33) and two plates are in the second-highest magnification position (m = 1.6). Cables running from the PMTs to the electronics are visible.
The mean detector response function (MDRF) was found for each camera.6 This process involves stepping a collimated source in a uniform grid over the camera face. A 78 × 78 grid of 1.5mm steps was used. At each point on the grid, list-mode acquisition is employed to store the nine PMT output values for each of ~ 5000 events. Later, a mean file is generated by finding the average output values for each of the nine PMTs at each point on the grid. This MDRF data is later used in conjunction with maximum-likelihood (ML) estimation to determine where a given gamma ray strikes the camera face. Depth of interaction was not taken into consideration. Because Poisson statistics apply, the log likelihood function is given by
| (2) |
where ōn(μx, μy) are the mean PMT outputs given by the MDRF for a location on the camera face (μx, μy) and on are the PMT outputs for the event in question. Note that the term on! may be neglected as it is constant for any given event. The (μx, μy) that maximizes λ(μx, μy) for a given o represents the most likely point of incidence for the gamma ray in question. The ML estimation process is repeated for every event acquired in an exposure and an image is constructed by binning each event into its proper location on the camera face.
After obtaining the necessary MDRF data for each camera, the system was assembled. Table 1 illustrates the system configuration used in this study. Two pinhole plates were inserted in the highest magnification position while two were placed in the second-highest magnification position. For each magnification, one plate had a single pinhole and one plate had multiple pinholes. The high-magnification, multiple-pinhole plate had four pinholes while the multiple pinhole plate at the second-highest magnification had five pinholes. For this initial work, we studied observer performance using various combinations of these four plates.
Table 1.
System configuration used in this study. Two pinhole plates were inserted in the highest magnification position while two were placed in the second-highest magnification position.
| Camera | Magnification | Pinhole Number |
|---|---|---|
| A | 1.60 | 5 |
| B | 3.33 | 1 |
| C | 1.60 | 1 |
| D | 3.33 | 4 |
2.2. Phantom
Images of mice taken with SPECT systems vary a great deal from animal to animal. This object variability substantially degrades the ability of an observer to perform a task. In fact, for most medical imaging systems, the degradation due to object variability far outweighs the degradation due to image noise.7 A phantom capable of capturing such object variability was required. Also, it was necessary to obtain hundreds of these random background images in a relatively short span of time. We developed a hollow cylindrical phantom with a diameter of 30mm, roughly that of a small mouse. The cylinder was filled with non-uniform polystyrene beads ~4mm in diameter as shown in Figure 3. A dilute radioactive source filled the negative space around the beads. Images of the phantom taken with this configuration resulted in the desired random background. Stirring of the bead mixture in between images sufficiently altered the arrangement of the beads and allowed for rapid acquisition of many random background images. Inspiration for the phantom was found in previous work conducted by Sain.8 A total of 150 bead images were taken of which 138 were used in this study.
Figure 3.

Bead phantom used to generate random background images. The phantom is filled with non-uniform polystyrene beads which are then stirred after each image to simulate object variability. Radioactive liquid occupies the negative space surrounding the beads.
2.3. Signal
Having decided upon signal detection as the task for which to optimize our system, it was necessary to procure a signal. Readily available commercial products proved too small, too large, or too expensive for our purposes. Ultimately, a small amount of modeling compound was saturated with source and molded into a 2 mm diameter, roughly spherical source. The source was affixed to the end of a wooden dowel and mechanically lowered into the system. Careful observation of count rates enabled centering of the source and a stage provided the means to accurately translate the source within the system. Exposure times were calculated to insure that the ‘hottest’ camera would have ~ 2,000,000 counts. Obtaining such a large number of counts insured relatively noise-free signal images. Several signal images were taken although only one was selected for use in this study. The projected images of the chosen signal are shown in Figure 4. Figure 4(a) is from the low-magnification, multiple-pinhole (LM-MP) camera and has five pinholes. Figure 4(b) is from the high-magnification, single-pinhole (HM-SP) camera. Figure 4(c) is from the low-magnification, single-pinhole (LM-SP) camera. Figure 4(d) is from the high-magnification, multiple-pinhole (HM-MP) camera and has four pinholes.
Figure 4.

Signal images taken of a 2mm diameter sphere-shaped source. Observation of camera count rates were used to roughly center the source. Long exposure times resulted in relatively noise-free images. (a) and (d) are projection images from pinhole cameras with five and four pinholes, respectively. (b) and (c) are projection images from single-pinhole cameras.
3. ANALYSIS AND RESULTS
3.1. Linearity
Because of the linearity of the system, we were able to take separate long-exposure (i.e. low noise) signal and bead data and combine them to form signal present image data. If we let b̄i be the ith mean background and s̄ be the mean signal data, then the ith mean signal projection image was generated by ḡi = βb̄i + αs̄ where α and β are factors related to signal strength and exposure time. The final image data was then formed by sampling a Poisson vector g with mean ḡ. Figure 5 shows an example image from the low magnification, single pinhole (LM-SP) camera both with and without the signal image present. To aid in visualization, a far stronger signal was used in the example image than was used in the study.
Figure 5.
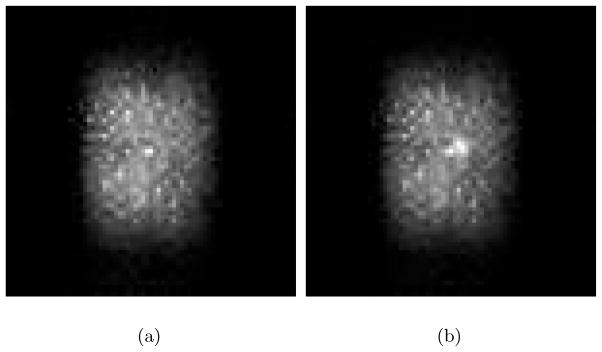
(a) Signal absent bead projection image from a single low-magnification pinhole. (b) Signal present bead projection image from a single low-magnification pinhole. Modeling compound was shaped into a 2mm diameter sphere and saturated with source to form the signal. To aid in visualization, a far stronger signal is shown here than was used in the study.
3.2. Channelized Hotelling Observer
The efficient channelized Hotelling observer (CHO) with Laguerre-Gauss (LG) channels centered on the known projected signal locations was employed to calculate SNR values.9 Because the signal has multiple projections, the LG channels must be applied at numerous locations in the projection data. Two approaches were explored to address CHO calculations with multiple cameras. In the first approach, the channel matrix is generated by concatenating the channel matrices for each camera. The resulting channel outputs ci (for data gi) have dimensions of C × IN and the resulting covariance matrix has dimensions of C × C where C is the number of channels, I is the number of elements in the projection data, and N is the number of cameras.. In the second approach, the channel matrix T is again generated from the channel matrices for each camera but in block diagonal form instead of through concatenation. The resulting channel outputs have dimensions of CN × IN and the resulting covariance matrix has dimensions of CN × CN.
Four channels were used to generate the channel matrix T. An estimate of the covariance matrix Kc was given by the covariance of the channel outputs ci = Tgi. We were then able to find the difference in channel outputs T
| (3) |
where α is the signal strength, and finally SNR2
| (4) |
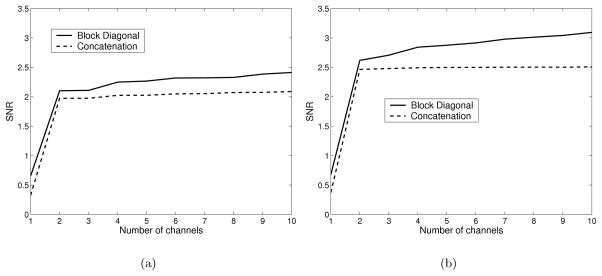
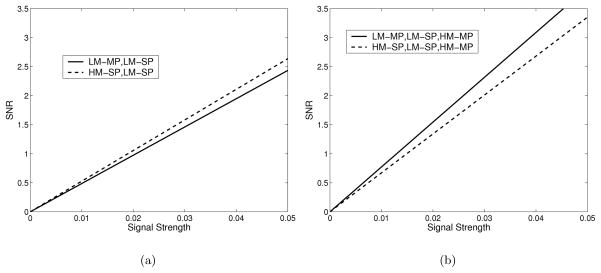
As shown in Figure 6 the block diagonal channel matrix results in higher SNR than the concatenated channel matrix for multiple cameras. The two techniques produce the same SNR for the single camera case. The SNR is perfectly linear and its slope depends solely on α, the multiplicative factor determining signal strength.
Figure 6.
Effect of channel matrix construction on SNR for (a) a combination of LM-MP, HM-SP, and LM-SP cameras, and (b) all four cameras. The two methods produce identical SNR values for the single camera case.
3.3. Bootstrapping with Train and Test
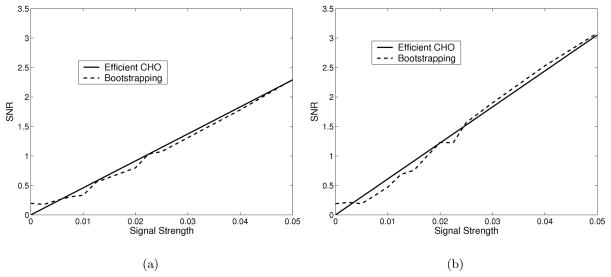
A separate (and much more time-consuming) measure of SNR was implemented using bootstrapping with train-and-test (T&T).10 This method was performed to validate our computation of CHO SNR. Four image data matrices were generated, two with signals and two without signals. Random selection of image data with replacement (a hallmark of bootstrapping) was used to generate the image data matrices. One set of signal present and signal absent image data was designated as the training set while the other was designated as the testing set. The difference in channel outputs Δc̄ and covariance matrix Kc were computed using the training set. The test statistics, from which the SNR was calculated, were formed using the test set. This approach neglects the separability of signal and bead data (i.e., the fact that bead and image data were acquired separately), making it a more general technique. Because the mean difference in channel outputs Δc̄ is an estimate, the SNR does not follow a perfect line as it did with the CHO method. None the less, the SNR values generated by these two methods showed excellent agreement and we were able to choose the faster, cleaner CHO method. Comparisons of SNR found by these two methods for both a single camera and two camera case are shown in Figure 7.
Figure 7.
Comparison of SNR found by efficient CHO with four Laguerre-Gauss channels and bootstrapping with train and test using fifty iterations for (a) the LM-MP camera and (b) a combination of LM-MP and HM-SP cameras
3.4. Signal-to-Noise Ratio
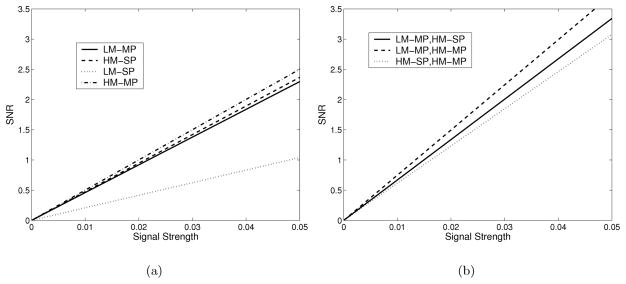
For the single-camera case, the HM-MP camera produces the highest SNR values while use of the LM-SP camera results in the lowest SNR values. Intuitively, one would expect the image with several large signals to produce a higher SNR than one with a single, smaller signal; the data reflects this intuition. Also, the HM-SP has slightly higher SNR than the LM-MP camera. The SNR results for a single camera are shown in Figure 8(a). The SNR is linear with respect to the signal strength α as expected.
Figure 8.
(a) SNR for a single camera. As expected intuitively, the HM-MP camera produces the largest SNR values while the LM-SP camera produces the lowest SNR. (b) SNR for two cameras. Two camera combinations excluding the LM-SP camera are shown. Note that the HM-MP, LM-MP combination yields higher SNR than the HM-MP, HM-SP combination despite the fact that HM-MP and HM-SP had the highest SNRs as single cameras.
Investigation of SNR with multiple cameras yields more interesting results. For the two camera case, the combination of HM-MP and LM-MP results in higher SNR values than the HM-MP and HM-SP combination despite the fact that for the single camera case the HM-SP had slightly higher SNR than the LM-MP. The preceding result, shown in Figure 8(b), indicates that the addition of a second magnification may provide more information for signal detection tasks than the addition of a second camera at the same magnification (even if that camera has a higher SNR when used individually). Further, for the three camera case, shown in Figure 9, it appears that the HM-MP camera boosted SNR more when added to the low-magnification camera combination than when added to the camera combination containing both a high-magnification and low-magnification camera. As expected, the SNR trends upward as cameras are added and the combination of all four cameras produces the highest SNR values of any combination. These results imply a potential gain in signal detection through proper manipulation of magnification and pinhole configuration — both optimizable parameters — and also caution against blindly increasing magnification and pinhole number or arrangement as the most advantageous approach to hardware optimization.
Figure 9.
(a) Two two-camera combinations, one with cameras of like magnification and one with cameras of differing magnification. (b) Two three-camera combinations including the addition of the HM-MP camera. Note the relative increase in SNR when the HM-MP camera is added to the two LM cameras as opposed to the HM-MP camera’s addition to the HM, LM combination.
4. DISCUSSION AND CONCLUSIONS
The ideal or Bayesian observer is one that utilizes all statistical information available regarding a task to maximize a particular measure of performance.1,2 Its application is far more rigorous and time-consuming than either of the methods described here. We have developed methods for computing ideal observer performance in simulation and have applied these methods to M3R with the geometry used here. A future publication will discuss the correlation between the results presented in this paper and the ideal observer study. The ability to optimize magnification and pinhole configurations in simulation with the ideal observer could be a tremendous boon to our research, helping to streamline the expensive and laborious process of hardware optimization. The methods presented here constitute a valuable tool for validating optimizations and for comparing different hardware configurations.
The preliminary work presented here utilized a relatively small number of images and focused on only one signal. The only source of noise arises from the estimate of a small covariance matrix. Even so, we need to compute error bars and determine statistical significance before more substantive conclusions can be drawn. Also, a wider array of signals with varying size and location will be explored.
A system and methodology for the experimental validation of theoretical hardware optimization techniques was successfully developed. So-called lumpy backgrounds and signals images were imaged and used to compute observer performance. Preliminary results support intuitive understanding and also indicate the potential for increased signal detection capability through the use of multiple pinholes and variable magnification. It is clear that multiple magnifications and multiple pinholes will increase observer performance. However, the configuration of these parameters that will produce the best task performance remains unknown. The work here presents the methods and phantoms that will aid in answering this important question.
Further studies involving larger numbers of bead images, a wider range of signal sizes and locations, and new magnification and pinhole configurations will be performed. A second and arguably more complicated task — namely signal location estimation — will also be addressed.
Acknowledgments
This work was supported under NIH/NIBIB Grants R01-EB002146 and P41-RR14304.
Footnotes
Cerrobend is harder than lead and has a melting point of 58° Celsius, making it an attractive alternative to lead for certain applications. The composition of Cerrobend is 50% bismuth, 26.7% lead, 13.3% tin, and 10% cadmium.
References
- 1.Barrett HH, Myers KJ. Foundations of Image Science. Wiley; Hoboken, New Jersey: 2004. [Google Scholar]
- 2.Kupinski MA, Hoppin JW, Clarkson E, Barrett HH. Ideal-observer computation in medical imaging with use of Markov-chain Monte Carlo techniques. Journal of the Optical Society of America A. 2003 Mar;20:430–438. doi: 10.1364/josaa.20.000430. [DOI] [PMC free article] [PubMed] [Google Scholar]
- 3.Abbey CK, Barrett HH. Human- and model-observer performance in ramp-spectrum noise: effects of regularization and object variability. Journal of the Optical Society of America A. 2001 Mar;18:473–488. doi: 10.1364/josaa.18.000473. [DOI] [PMC free article] [PubMed] [Google Scholar]
- 4.Chen L, Barrett HH. Optimizing lens-coupled digital radiographic imaging systems based on model observers’ performance. In: Chakraborty DP, Krupinski EA, editors. Medical Imaging 2003: Image Perception, Observer Performance, and Technology Assessment. SPIE; 2003. pp. 63–70. [Google Scholar]
- 5.Gross K, Kupinski MA, Peterson T, Clarkson E. Optimizing a multiple-pinhole SPECT system using the ideal observer. In: Chakraborty D, Krupinski EA, editors. Medical Imaging 2003: Image Perception, Observer Performance and Technology Assessment. SPIE; 2003. pp. 314–322. [Google Scholar]
- 6.Milster TD, Aarsvold JN, Barrett HH, Landesman AL, Mar LS, Patton DD, Roney TJ, Rowe RK, Seacat RH., III A full-field modular gamma camera. Journal of Nuclear Medicine. 1990;31(5):632. [PubMed] [Google Scholar]
- 7.Kupinski MA, Clarkson E, Hoppin JW, Chen L, Barrett HH. Experimental determination of object statistics from noisy images. Journal of the Optical Society of America A. 2003;20(3):421–429. doi: 10.1364/josaa.20.000421. [DOI] [PMC free article] [PubMed] [Google Scholar]
- 8.Sain JD. PhD thesis. University of Arizona; 2001. Optical Modeling, Design Optimization, and Performance Analysis of a Gamma Camera for Detection of Breast Cancer. [Google Scholar]
- 9.Gallas BD. PhD thesis. University of Arizona; 2001. Signal Detection in Lumpy Backgrounds. [Google Scholar]
- 10.Efron B, Tibshirani RJ. An Introduction to the Bootstrap. Chapman & Hall/CRC; 1993. [Google Scholar]


