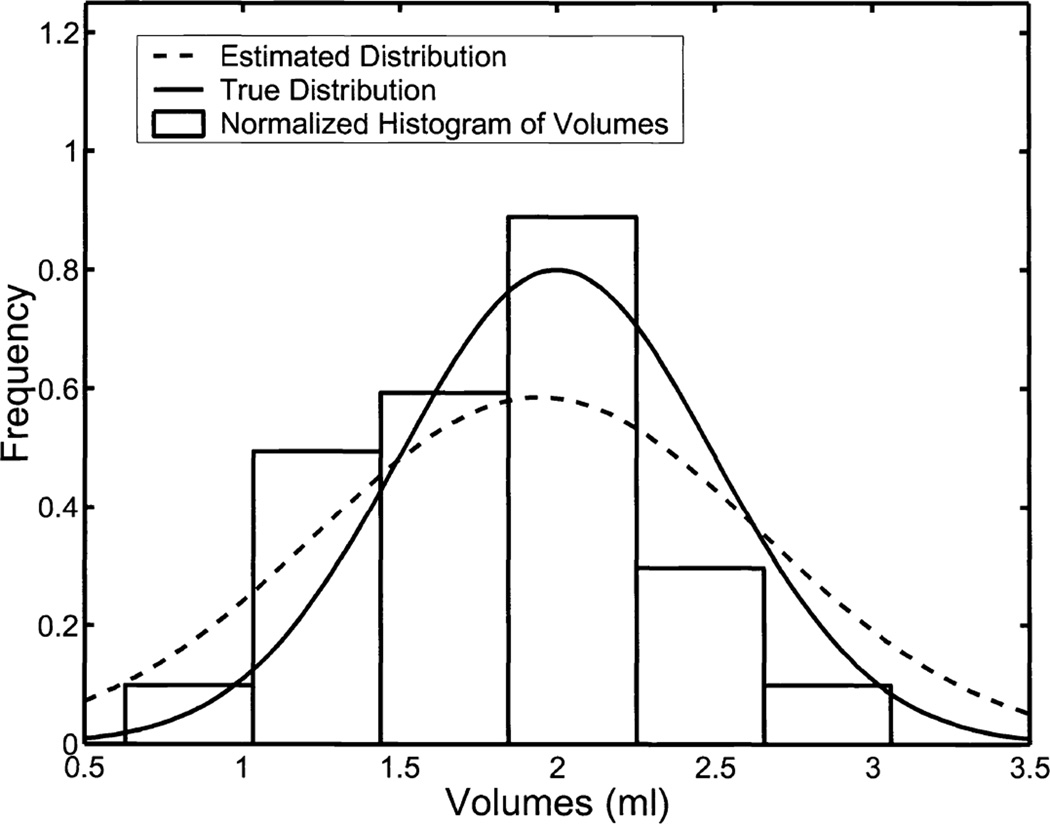
Figure 5.
A comparison of the normalized histograms for the underlying volumes with the parameters returned by RWT estimating the mean and variance of the underlying gold-standard distribution. The true volumes were sampled from a truncated-normal distribution with a mean of 2ml and standard deviation of 0.5ml. The 25 volumes themselves had a sample mean of 1.8016ml and sample standard deviation 0.5607ml. Our no-gold-standard analysis predicted a mean of 1.9444ml and a standard deviation of 0.7057ml.

