
Fig. 5.
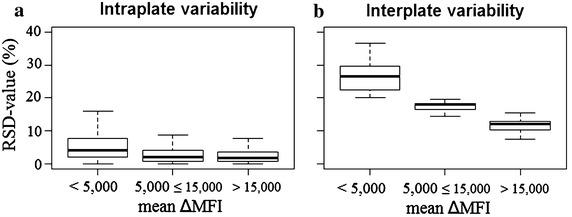
Reproducibility of the immunoassay based on the quality control samples in the immunoassay applied on field collected samples. The relative standard deviation (RSD, y-axis) is plotted in relation to the mean ΔMFI values (x-axis) obtained from the assay. The boxplots represent the 75th percentile, median and 25th percentile of the RSD values from the intercoupling, intraplate and interplate variability per dilution (1:100, 1:400 and 1:1600). Whiskers represent the maximal and minimal outlier limits