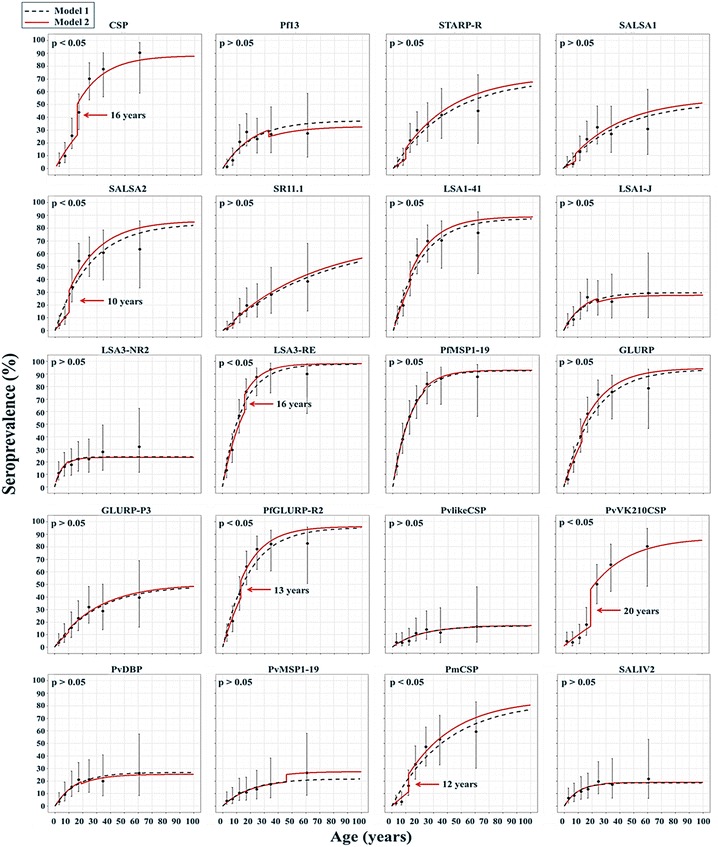
Fig. 6.

Age-seroprevalence curves for all antigens analysed by the multiplex assay. Reversible catalytic conversion models allowing one (dashed black line, Model 1) and two (red solid line, Model 2) seroconversion rates were fitted to the data. For six Ags the model allowing two SCRs fitted better as compared to one SCR
