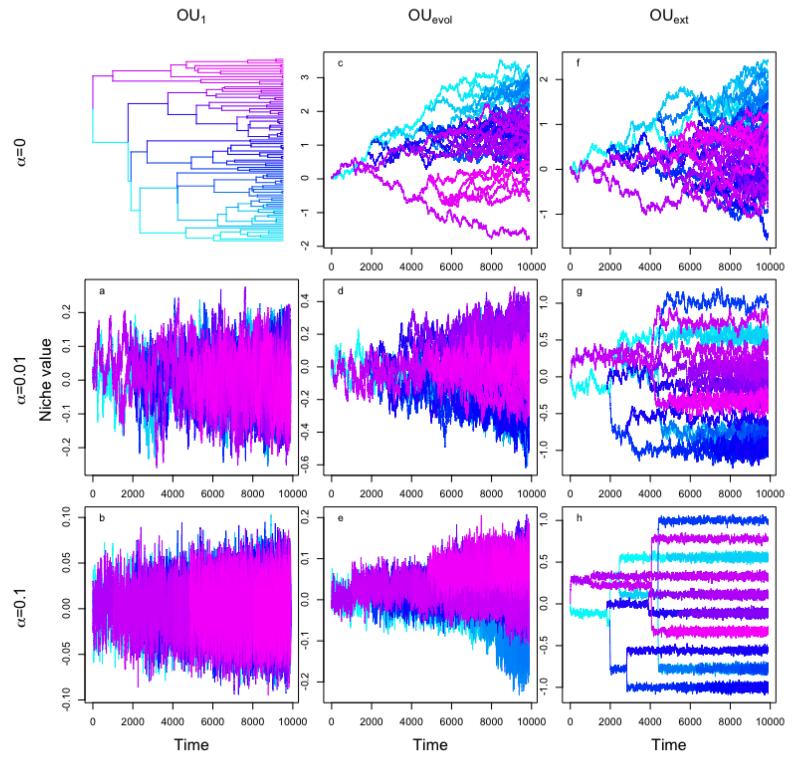
Figure 1.
Niche evolution over time for an OU1 (left column), OUevol (middle column) and OUext (right column) model with different strength of selection (α). The upper left plot shows the phylogeny; the middle and the upper right plot show two realizations of BM. Colours indicate the position of branches in the phylogeny. When considering only the final distribution of niche values in the tips, then a OU1 model with strong α can be easily misidentified as a white noise model and an OUext model with moderate α can be easily misidentified as a BM model

