Figure 2.

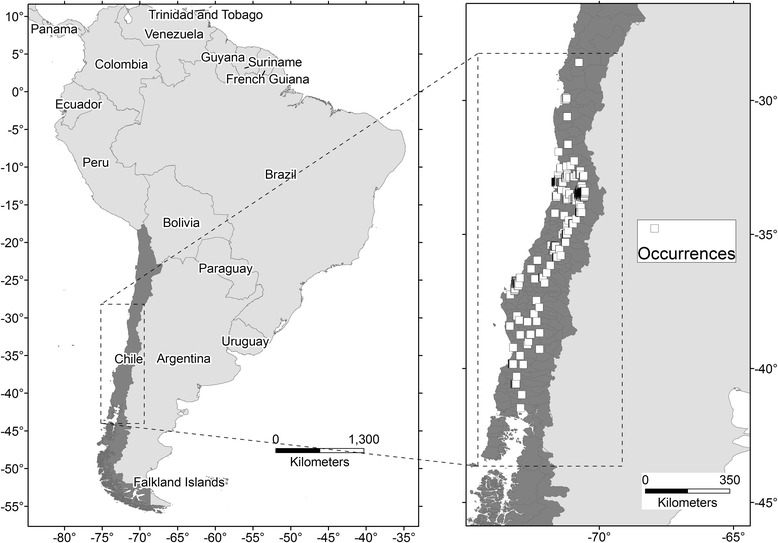
Study areas for model calibration and validation (M). Left: geographic position of Chile (dark gray). Right: study areas within central Chile (dark gray) and occurrence points (white squares) in the calibration area (dashed line).

Study areas for model calibration and validation (M). Left: geographic position of Chile (dark gray). Right: study areas within central Chile (dark gray) and occurrence points (white squares) in the calibration area (dashed line).