Fig. 7.

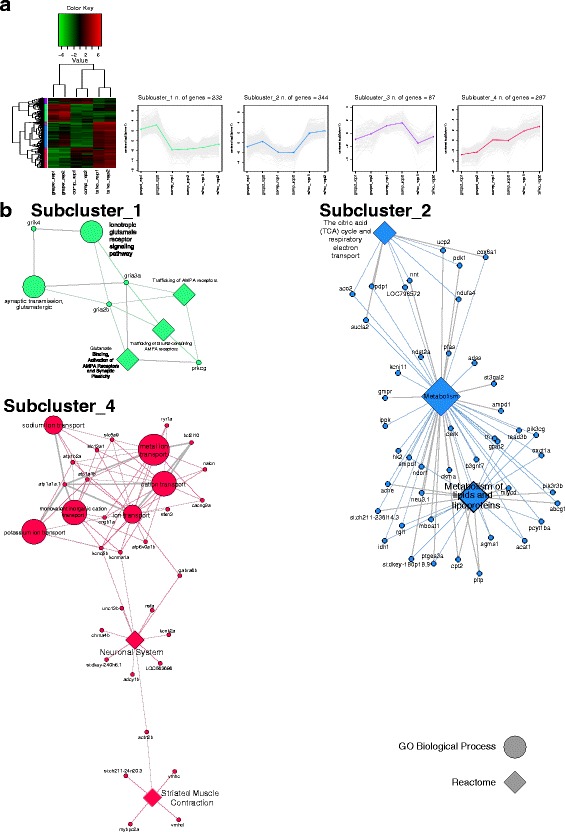
Cross-species analysis (EO). a Results of the DE analysis. Left: heatmap showing the differentially expressed genes clustered by expression levels. Expression sub-clusters obtained from k-mean clustering. Each cluster groups together genes characterized by similar expression levels. b Networks showing significantly enriched terms and their relative genes for each sub-cluster
