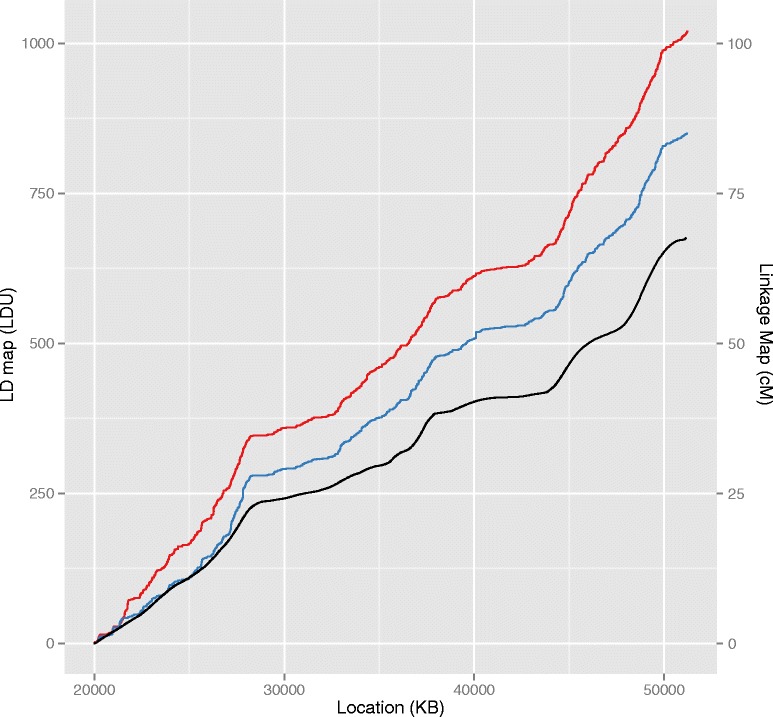
Fig. 1.

Comparison of LD maps from ABG and WGS, and linkage map. Comparison of WGS (red) and ABG (blue) CEU LD maps (left ordinate axis scale) and linkage map (black; right ordinate axis scale) for chromosome 22. Linkage map shown is from the June 2012 release of the Rutgers Map v3, interpolated using the Kosambi function (available at http://compgen.rutgers.edu/download_maps.shtml) [12]
