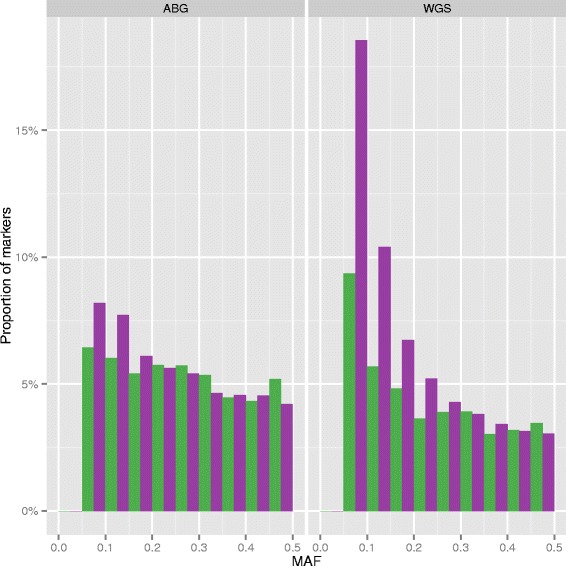
Fig. 4.

Distribution of allele frequencies between data sources. Histogram showing MAF distributions within ABG (left panel) and WGS (right panel) datasets for CEU (green) and YRI (purple) populations. A MAF bin width of 0.05 has been used. The median MAF for CEU is 0.25 and 0.21 for the ABG and WGS data respectively; the same metrics for the YRI are 0.23 and 0.15 respectively
