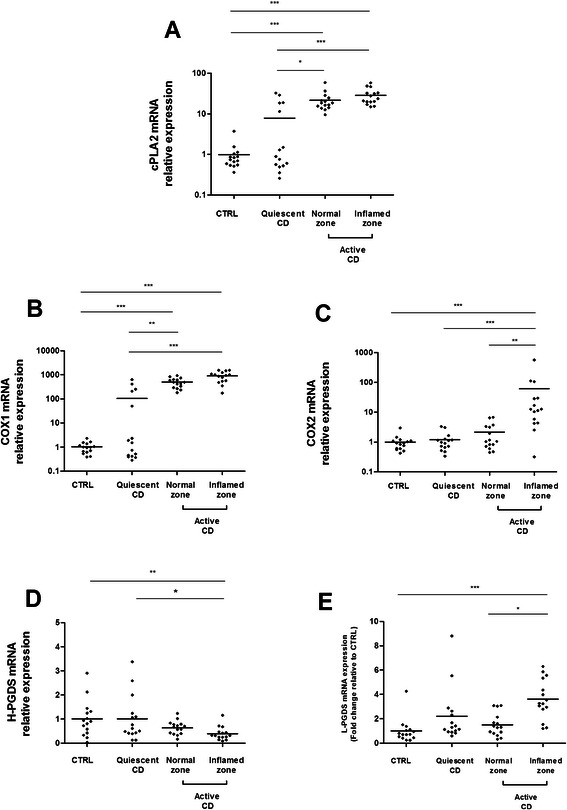
Fig. 2.

Quantitative RT-PCR analysis of cPLA2 (a), COX1 (b), HPGDS (c), COX2 (d), L-PGDS (e), gene expression in colonic biopsies from healthy subjects (CTRL), CD patients with quiescent disease or active disease (normal zone and inflamed zone). Data were normalized to MRPS6 gene expression (n = 15; ***p <0.001; **p < 0.01; *p < 0.5, Kruskall-Wallis test followed by Dunn’s post hoc test)
