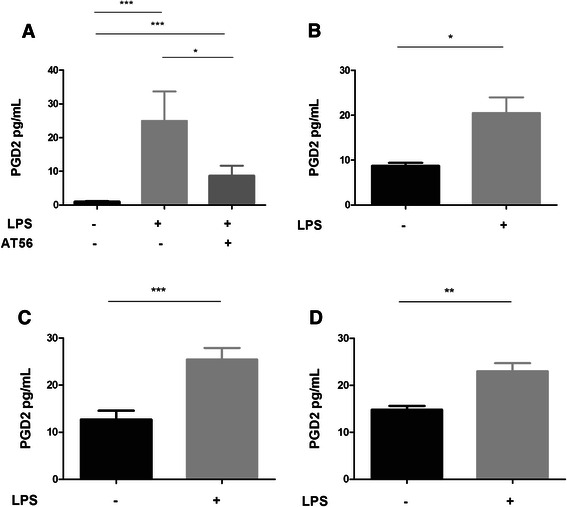
Fig. 7.

Enteric nervous system and PGD2 production in inflammatory conditions. Primary culture of ENS with and without LPS +/− AT-56 (95 μM) (a) (n = 12); coculture of ECG with neurons +/− LPS (b), EGCs culture +/− LPS (c), Neurons culture +/− LPS (d). Data were expressed as mean +/− SEM (n = 8), (Kruskall-Wallis test followed by Dunn’s post hoc test was used for Fig. 6a, Mann–Whitney test was used for Fig 6b, c, d)
