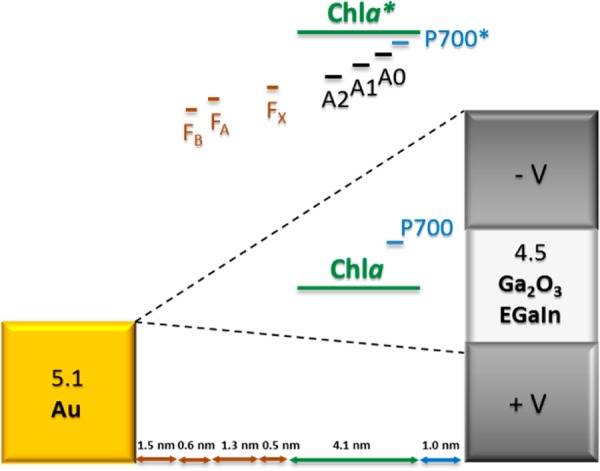
Figure 6.

Energy level diagram across AuTS-PSI(P700/FB)//Ga2O3/EGaIn junctions. The barrier width is defined by the thickness of one oriented PSI complex, which is depicted in the “down” orientation with respect to the natural direction of electron flow. The green lines are the frontier orbital energies of the chlorophyll molecules, which are distributed evenly through the thickness of the PSI complex. The black lines represent the energies of the electron transport chain and their relative spatial positions. On the basis of the orientation of the electron transport chain, more current should flow when the EGaIn electrode is biased negatively than at the equivalent positive bias. That mechanism would translate into higher values of R when the complexes are oriented “up” (because this figure is drawn with respect to the wiring of EGaIn junctions; Figure 4 shows the data with respect to the wiring diagram of CP-AFM). However, in our experiments we observe more current at the positive bias, which supports our dipole moment hypothesis. The distances between cofactors were estimated with the software PyMOL from a crystal structure of PSI taken from the Protein Data Bank (1JB0).
