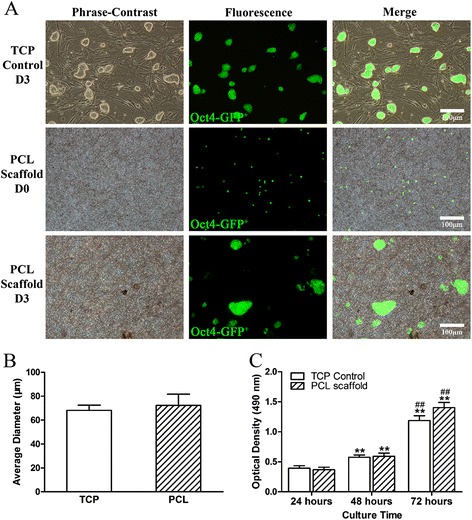
Fig. 2.

miPSC proliferation on PCL nanofibrous scaffolds. a Images of Oct4-GFP+ miPSCs cultured on 3D PCL nanofibrous scaffolds and in tissue culture plates (TCPs) with mouse embryonic fibroblast (MEF) feeder layers for the indicated times. b Colony diameter analysis. c MTT assay for miPSC proliferation on gelatin-coated 3D PCL nanofibrous scaffolds (PCL scaffold) and in gelatin-coated TCPs (TCP Control). All data are presented as the mean ± SE. *Significantly different compared with the TCP control group at 24 h. #Significantly different compared with the PCL scaffold group at 48 h. **, ## P < 0.01. n = 5
