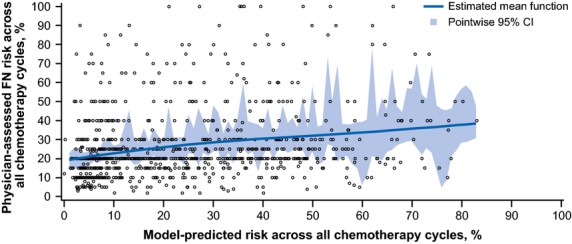
Figure 2.

Spline fit for the correlation between the physician-assessed and model-predicted febrile neutropenia risk over all chemotherapy cycles. The line indicates the estimated mean function, and the shaded area indicates the 95% pointwise CI. Physician-assessed FN risk estimates varied considerably around the model-predicted risk estimates and did not increase linearly with increasing model-predicted estimates above 30%. FN, febrile neutropenia.
