
Figure 3.
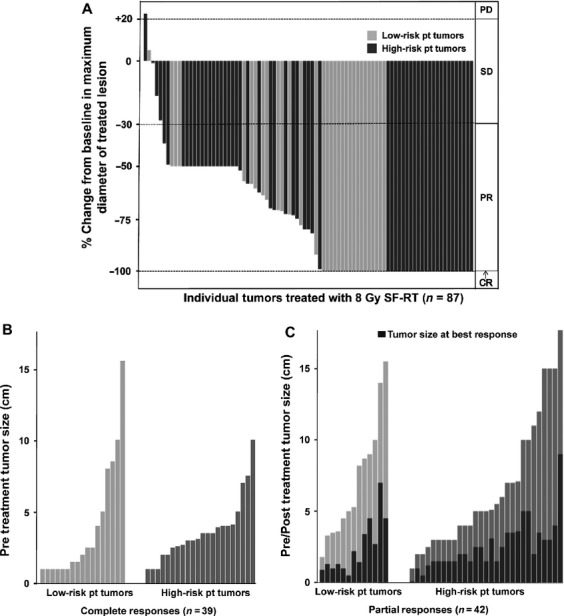
Tumor responses to SFRT: Of 92 tumors, 87 had both pre- and post-SFRT size measurements and could be included in this analysis (summarized in Fig.1). In each panel, light gray bars represent low-risk patients who have no known immunosuppression and have not received prior chemotherapy; dark gray bars represent high-risk patients who have known systemic immune suppression and/or have received prior chemotherapy for MCC. (A) A waterfall plot of the percent change in largest treated lesion diameter at best response after SFRT as compared with baseline. Response criteria as per RECIST 1.1 12 are as indicated on right of graph: CR, complete response; PR, partial response; SD, stable disease; PD, progressive disease. (B) The pretreatment tumor size (largest dimension, in cm) for treated lesions that had a CR. 39 tumors with pretreatment measurements (22 high risk and 17 low risk) achieved CR. (C) The reduction in tumor size comparing pretreatment to best response for treated lesions that had a PR. Forty-two tumors (29 high risk and 13 low risk) achieved PR. The black bars in (C) (tumors with partial response) indicate tumor size at best response for each tumor. SFRT, single-fraction radiation therapy; MCC, Merkel cell carcinoma.