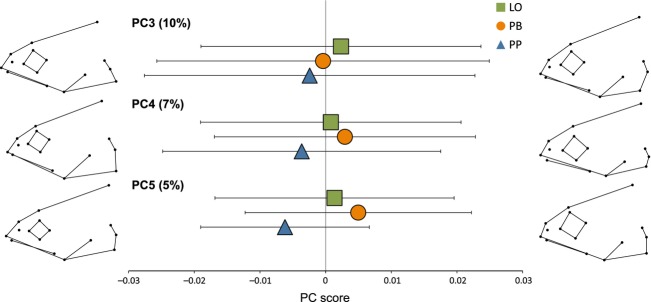
Figure 10.

Mean and standard deviation for the three morphs of Arctic charr for PC3, PC4, and PC5 from a principal component analysis of head shape. Illustrations show the head shape associated with individual extreme values at 0.06 and −0.06 for all three PC axes.
