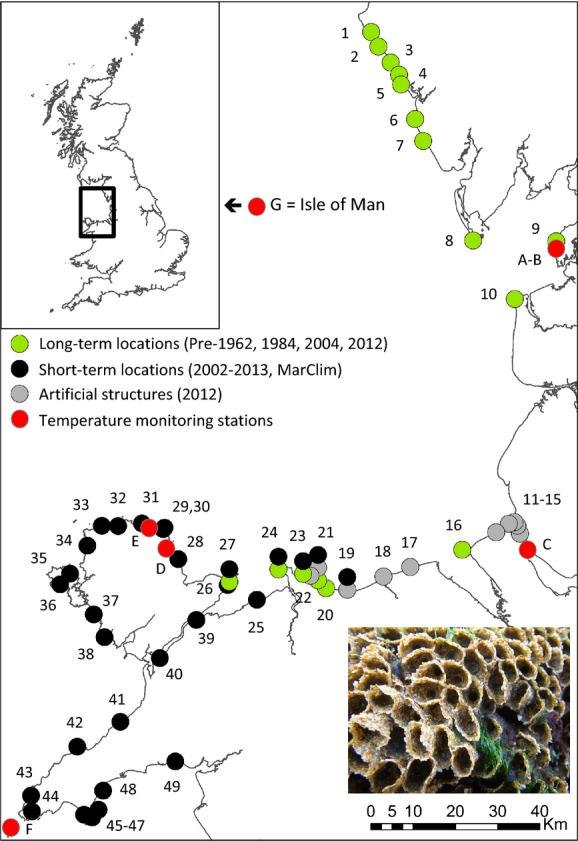
Figure 2.

Map of survey locations in northwest England and Wales. Green dots represent long-term locations that were sampled pre-1962, 1984, 2004, 2012; Black dots represent MarClim locations that were surveyed in the short term (2002–2013); gray dots represent locations with artificial coastal defense structures that were surveyed in 2012 and red dots represent locations where sea surface temperature measurements were recorded. Note that some locations fall into more than one category (see Tables4 for explanation of survey location numbers). A = Heysham; B = Heysham Power Station; C = Liverpool Bar Light Vessel; D = Moelfre; E = Amlwch; F = Bardsey Lighthouse; and G = Port Erin (Isle of Man). Inset image shows healthy S. alveolata with obvious “porches” indicating live individuals.
