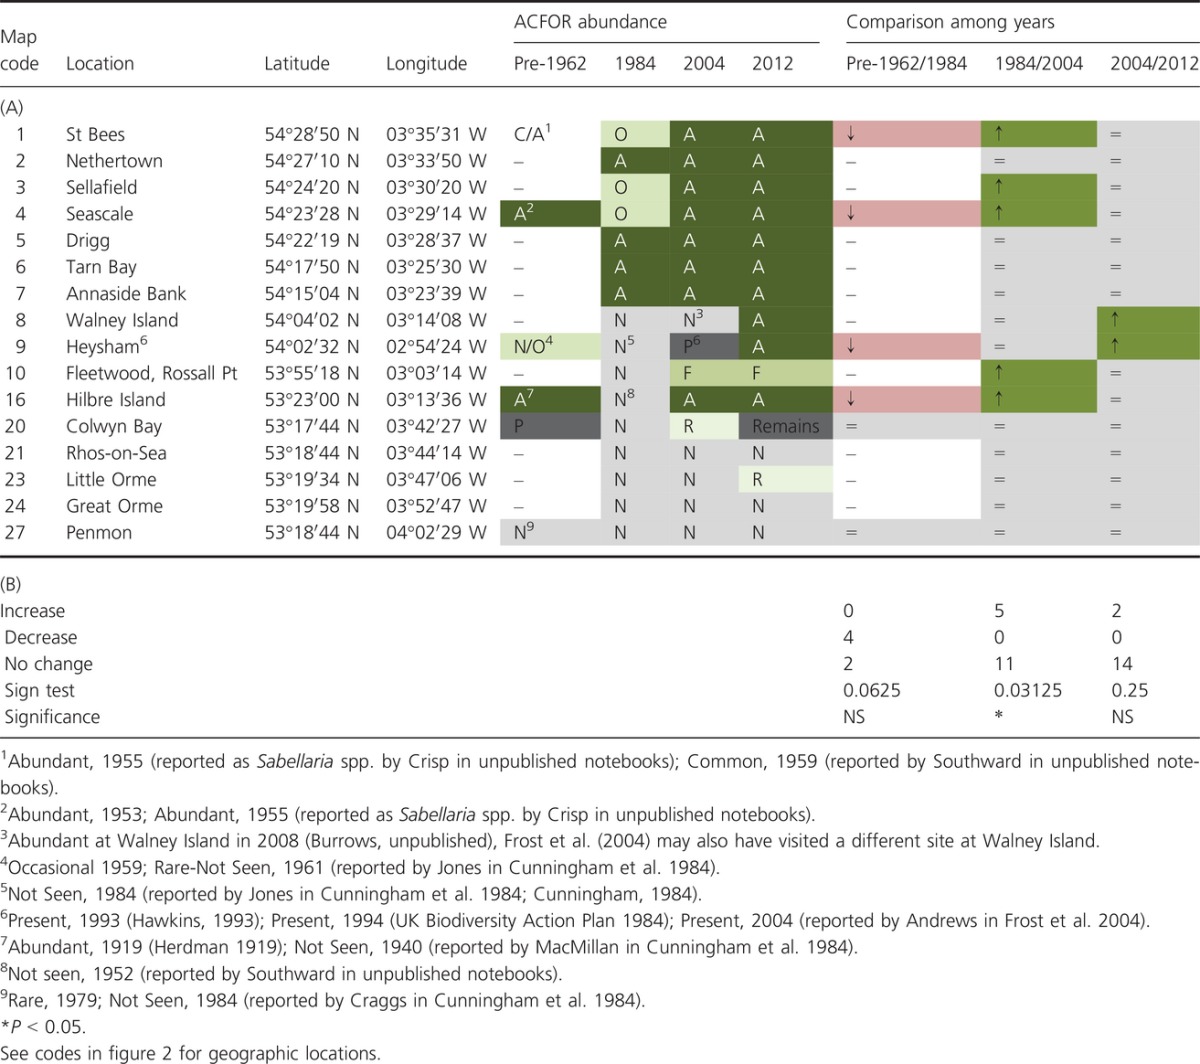
Table 3.
Long-term comparisons. (A) Historical and contemporary data on Sabellaria alveolata maximum ACFOR abundance in natural habitats in northwest England and Wales. Locations are listed form north to south. A = abundant, C = common, F = frequent, O = occasional, R = rare, N = not found, P = recorded as present but abundance not known. The relative changes in abundance (based on a two-step category change) to the previous survey(s) are shown. “↑” denotes increase, “↓” denotes decrease and “=” denotes no change. “Remains” = tubes of dead individuals. Pre-1962 data taken from Cunningham et al. (1984) and notebooks of Denis Crisp and Alan Southward. 1984 data taken from Cunningham et al. (1984). 2004 data taken from Frost et al. (2004). (B) Results of binomial sign tests comparing the number of locations exhibiting increased, decreased (based on a two-step category change), and no change in abundances among sampling periods.

