Fig. 5.
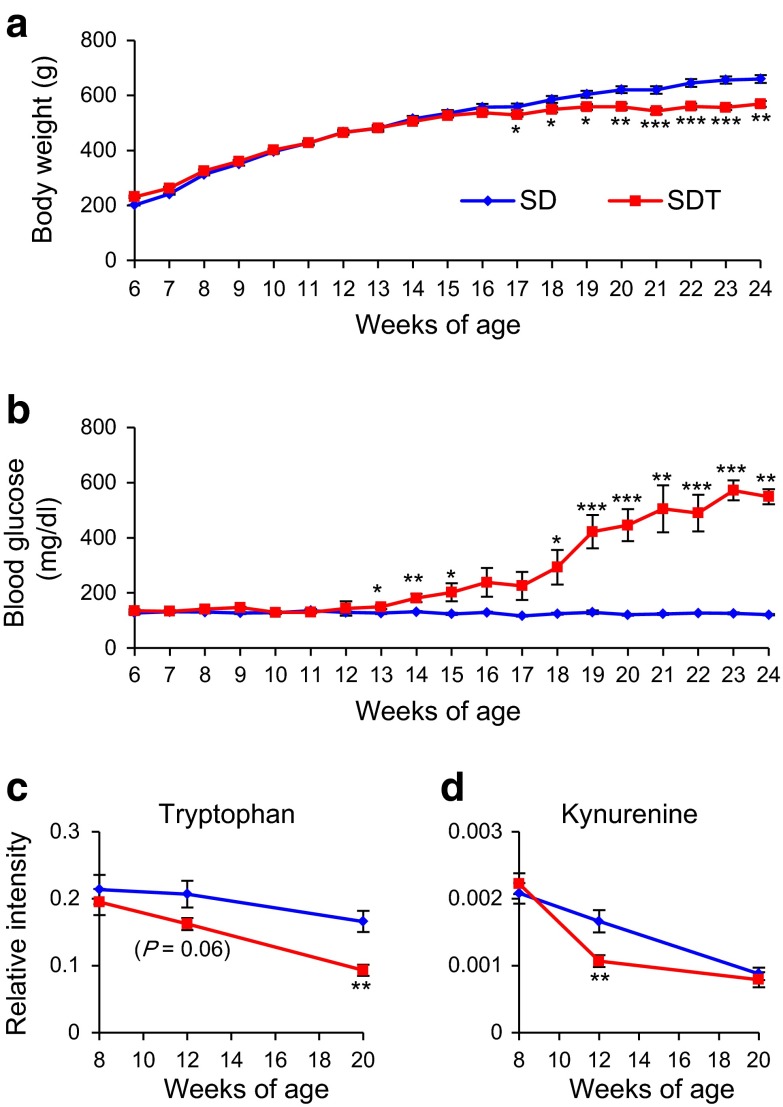
Replication study of SDT and SD rats. Longitudinal changes in a body weight and b non-fasting blood glucose level from 6 to 24 weeks of age (n = 10 each). Longitudinal changes in c tryptophan and d kynurenine levels (n = 10 each). The data are expressed as means ± SEM. Welch’s t test was used for evaluation of statistical significance. *p < 0.05, **p < 0.01, ***p < 0.001

