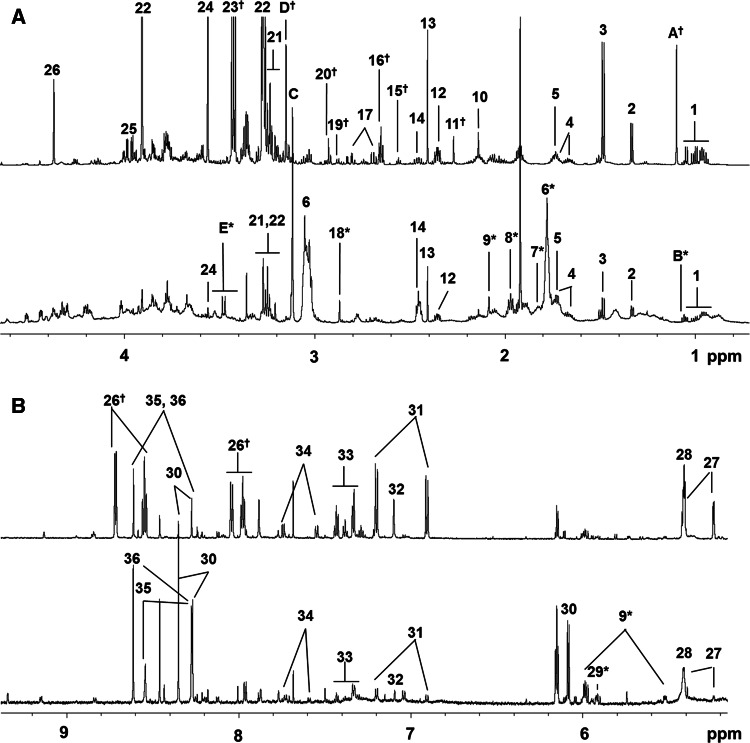
Fig. 2.
1H NMR spectral comparison of zebra mussel and SRM 1974c (M. edulis). Representative 1H NMR spectra of zebra mussel from the reference site (bottom), and M. edulis SRM 1974c (top) are shown. a Upfield NMR spectrum (0.0–4.0 ppm), b downfield NMR spectrum (5.0–10.0 ppm). (1) Leu, Ile, Val; (2) lactate, Thr; (3) Ala; (4) Arg; (5) Lys; (6) putrescine*; (7) ornithine*; (8) methyl-4-aminobutyrate*; (9) UDP-N-acetylglucosamine*; (10) Met; (11) acetoacetate†; (12) Glu; (13) succinate; (14) Gln; (15) β-Ala†; (16) hypotaurine†; (17) Asp; (18) trimethylamine*; (19) Asn; (20) l-methionine methylsulfonium iodide†; (21) choline, phosphocholine, glycerophosphocholine; (22) betaine; (23) taurine†; (24) Gly; (25) Ser; (26) homarine†; (27) maltose; (28) glycogen; (29) uridine*; (30) adenosine; (31) Tyr; (32) His; (33) Phe; (34) Trp; (35) ATP/ADP; (36) AMP. The asterisks indicates metabolites identified only in zebra mussel and (dagger) only in M. edulis. The unidentified peaks which have correlated 13C chemical shifts are labeled with A–E. (A) 1.10 ppm† (s); (B) 1.25 ppm* (s); (C) 3.12 ppm (s); (D) 3.15 ppm† (s); (E) 3.48 ppm* (d or two s). The complete list of annotated metabolites and their 1H and 13C chemical shifts are listed in Supplemental Tables 2 and 3

