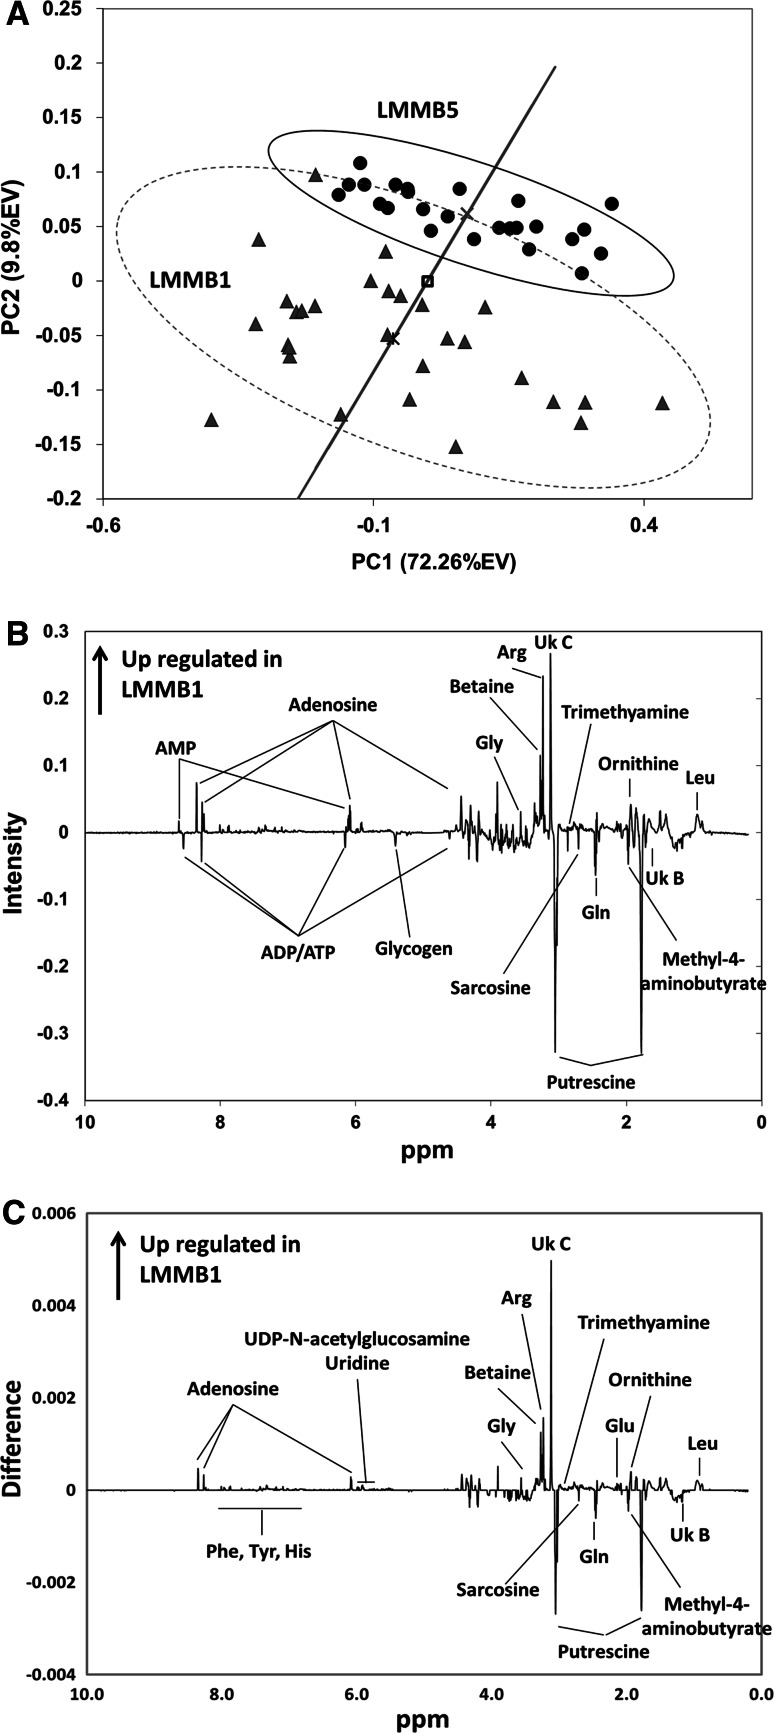
Fig. 4.
Differences between LMMB1 and the reference site. a PCA scores plot of the zebra mussels from impacted site LMMB1 (filled triangle), and the reference site LMMB5 (filled circle). The ovals indicate the 95 % Hoteling’s confidence interval. The solid line represents the projection of the scores onto the hybrid scores axis connecting the centers of each group. A Student’s t test for these projected points shows a significant difference between the groups (p = 5.65 × 10⁻⁶). The center of each group is represented by times for LMMB5 and asterisks for LMMB1 and open square for both groups. b A hybrid PCA loadings plot from multivariate analysis displaying the altered regions of NMR spectra between the two groups. c Significant difference spectra (SDS) based on Student’s t test and FDR correction. In both b, c, positive peaks indicate the up-regulated metabolites in LMMB1 compared to LMMB5 whereas the negative peaks are down-regulated metabolites

