
Fig. 4.
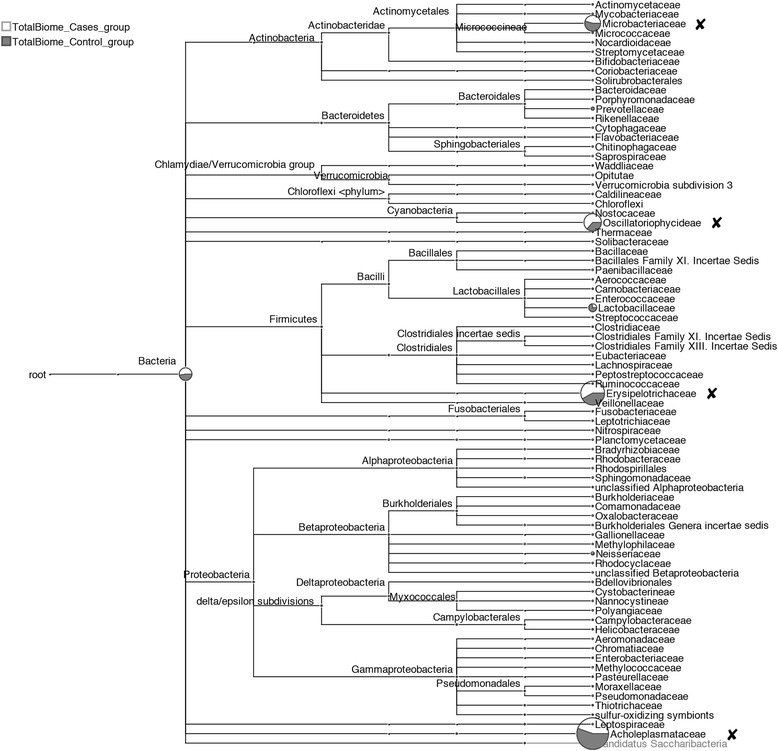
Taxonomic comparison of all DNA samples. Comparative tree view of merged samples (excluding samples 233, 238, and P0613) from unstable atherosclerotic plaques (white) and control group of stable plaques (gray) at “family” level of NCBI taxonomy. The scale shows the log value of reads assigned directly to a particular node. Some of the species hits that are likely to be of human origin are marked with black crosses