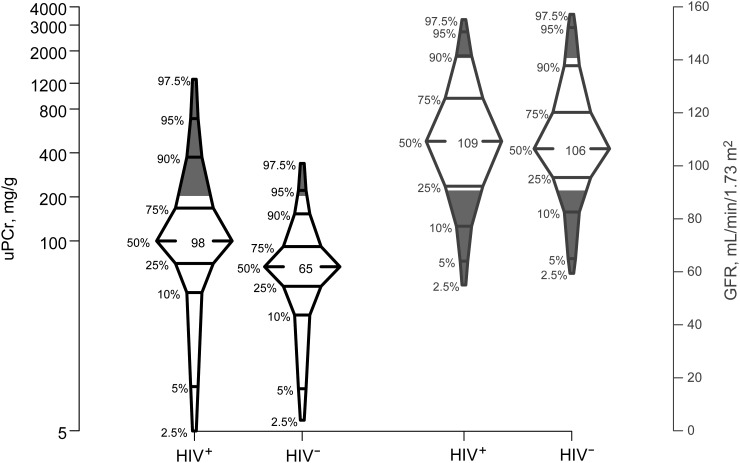
Figure 1.
Percentile box plots displaying the distribution of glomerular filtration rate (GFR) and urine protein-creatinine ratio (uPCr) among the sample of human immunodeficiency virus (HIV)–infected (HIV+) and HIV-uninfected (HIV−) men from the Multicenter AIDS Cohort Study. The shaded areas represent proportion with GFR values ≥140 mL/min/1.73 m2 or ≤90 mL/min/1.73 m2 (right) and proportion with uPCr >200 mg/g (left), comparing HIV-infected with HIV-uninfected samples.

