
Figure 3.
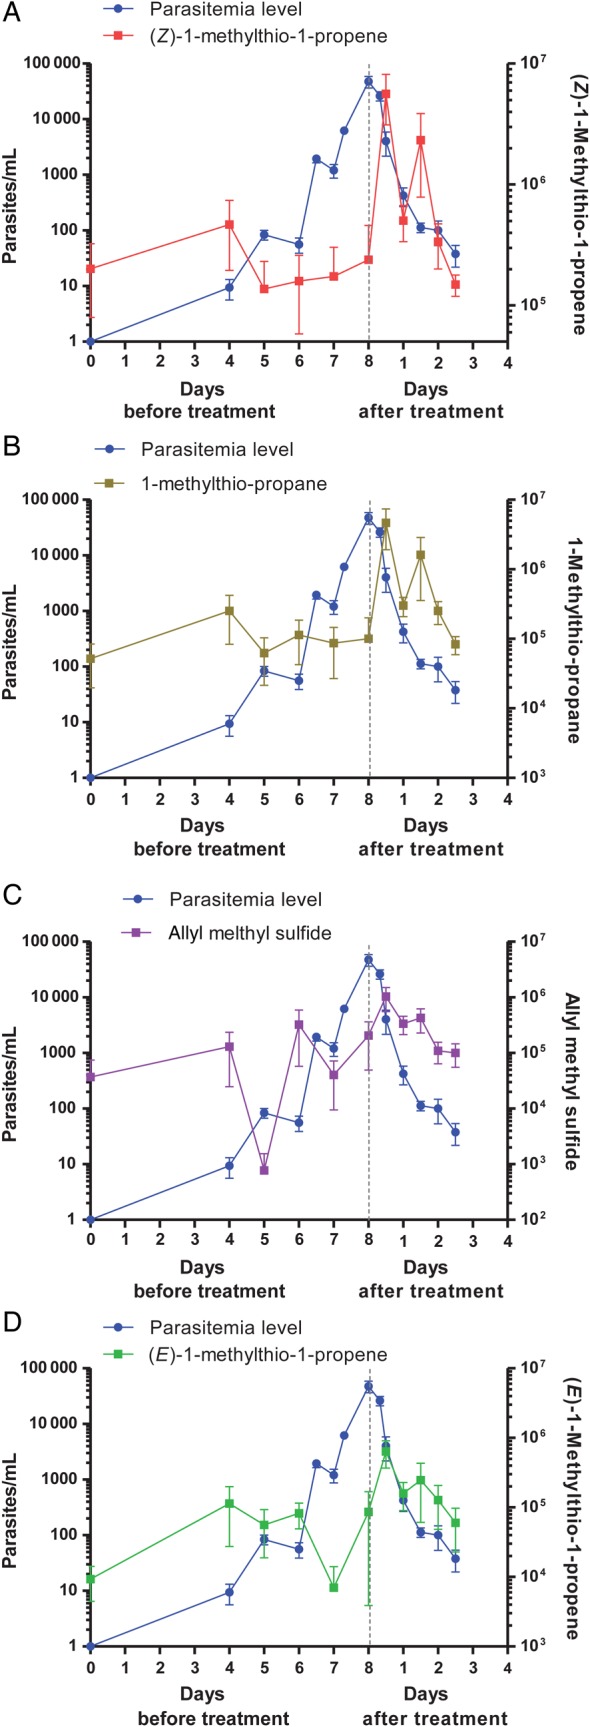
VOCs in breath (right y-axis) and parasite levels in blood (left y-axis) for cohort 2 during the course of experimental malaria before (during the first 8 days after infection onset) and after antimalarial treatment. Each participant in the cohort was inoculated on day 0 with approximately 1800 human erythrocytes infected with Plasmodium falciparum. Breath and blood samples were collected over the course of infection. Drug treatment (piperaquine) started on day 8 for cohort 2 (n = 6), as indicated by dotted vertical lines in the plots. Multiplication and clearance of parasites are denoted by blue circles, and the abundance of compounds is denoted by squares: (Z)-1-methylthio-1-propene (m/z 88), 1-methylthio-propane (m/z 90), allyl methyl sulfide (m/z 88) and (E)-1-methylthio-1-propene (m/z 88). Error bars represent standard errors of the mean.