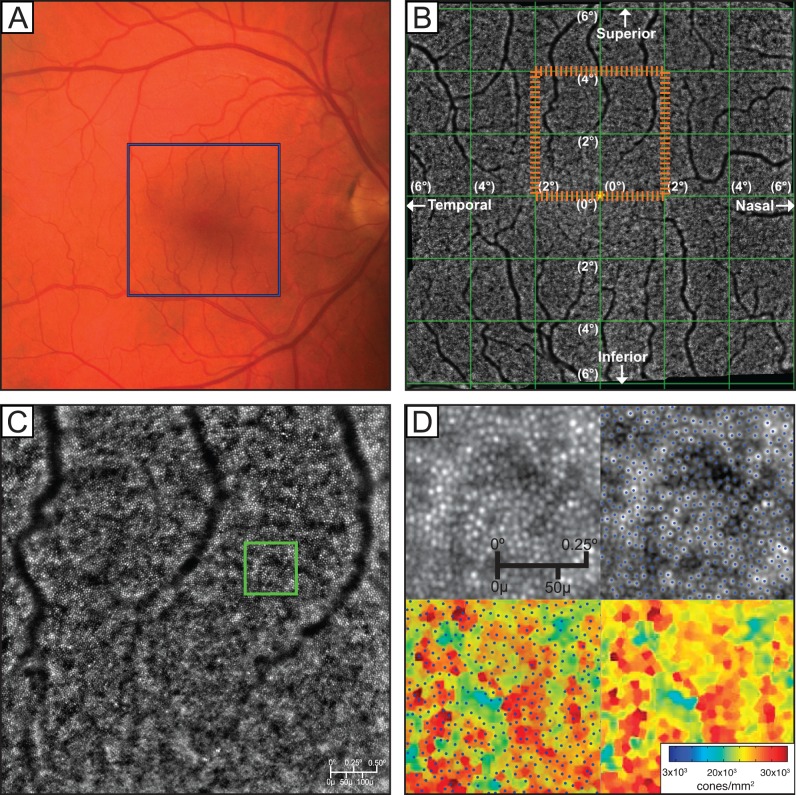
Figure 1.
(A) Color fundus photo. Blue box indicates the area covered by a complete 25 image AO montage. (B) The 12° × 12° montage created using 25 individual images. (C) Single 4° × 4° image created by the registration of 40 raw images using vendor-provided processing software. The orange dashed box on (B) indicates the position of (C) in the montage. (D) Magnified raw AO image, image with cones labeled by MATLAB cone-counting algorithm, labeled cones overlaid on the Voronoi plot, and the resulting Voronoi plot. The green box on (C) indicates the magnified area shown in (D).

