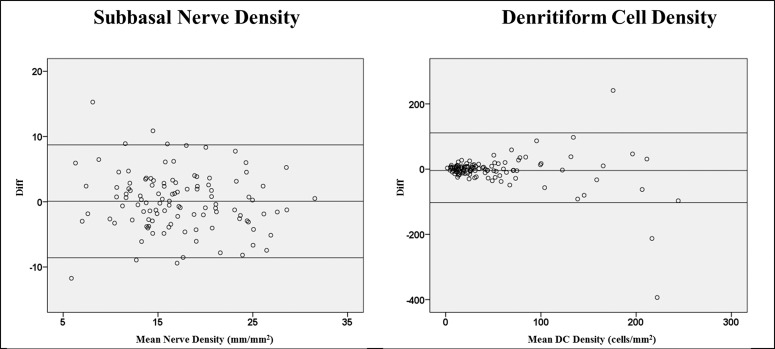
Figure 4.
Bland-Altman plots comparing the subbasal nerve and DC densities between the wide-field composite images and the three-set standard images. The 95% limits of agreement (LoA) are shown with up-and-down lines, and the central line represents the mean difference between these measurements. There were significant agreements between these two methods in measuring nerve and DC densities except for those with very low nerve density or very high DC density.

