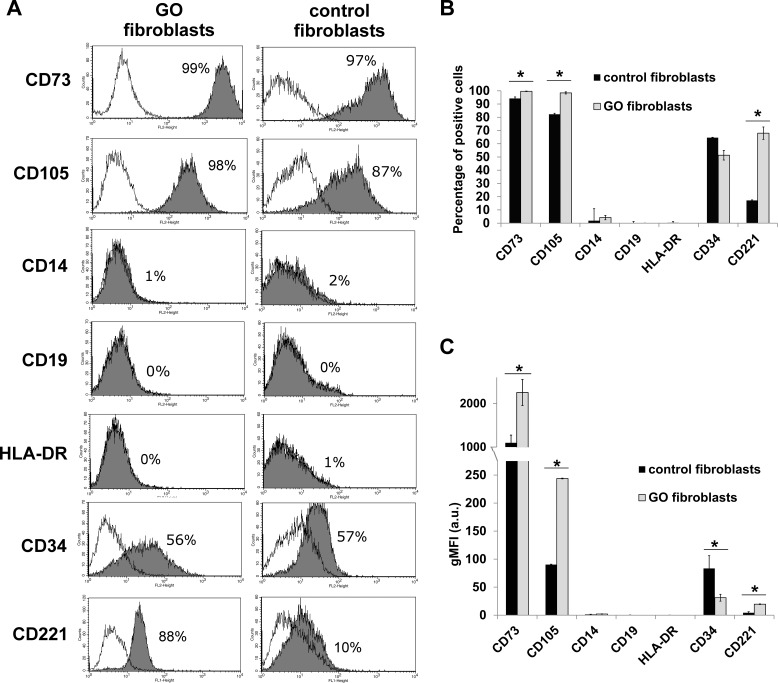
Figure 1.
Graves' orbitopathy and control orbital fibroblasts express MSC markers. The expression of MSC markers CD105, CD73, CD14, CD19, HLA-DR, and CD34,10 as well as CD221 (IGF-1R) was analyzed in GO and control fibroblasts using flow cytometry. (A) Representative flow charts for individual markers in one GO (line HO1) and one control (line CO2) fibroblast line. Gray areas represent specific marker expression profile, with the percentage of positive cells as indicated. White areas show the distribution of the fluorescence using nonspecific matching IgG isoform control. (B, C) Percentage of cells expressing the indicated marker (B) and geometric mean fluorescence intensity (gMFI) for each marker (C). Shown is the mean ± SEM for 3 GO and 3 control fibroblast lines, with n = 3 for each marker in each cell line. *Statistically significant difference between control and GO cells (P < 0.05).

