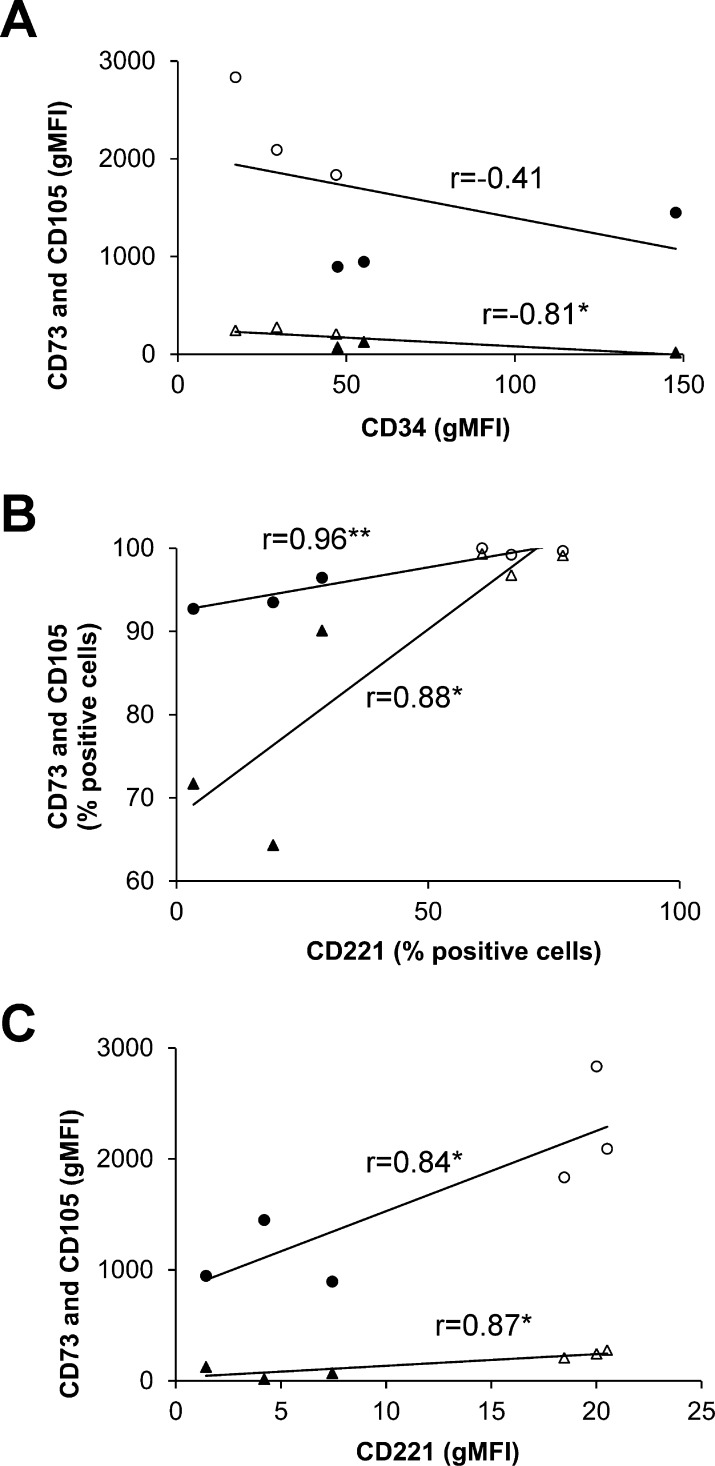
Figure 2.
Mesenchymal stem cell marker expression is correlated with disease profile. Pearson product-moment correlation analysis was performed between (A) expression levels (mean gMFI) of CD34 versus CD73 (circles) and CD105 (triangles); (B) percentage of cells expressing CD221 versus CD73 and CD105; and (C) expression levels of CD221 versus CD73 and CD105. Each point represents averaged data (n = 3) for each control (filled symbols) and GO (empty symbols) cell line. Statistically significant correlations: *P < 0.05, **P < 0.01.

