Figure 3.
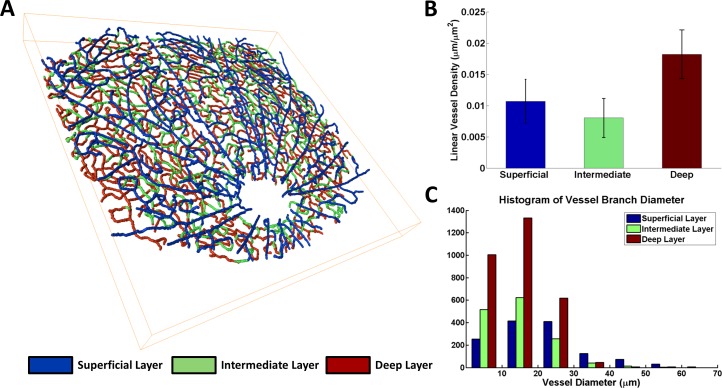
Topology of the retinal vasculature. (A) Skeletonization of inner retinal vasculature with different layers denoted by color (see also Supplementary Movie S1). (B) Linear vessel density for the three vascular layers. The error bars represent the SEM. (C) Histogram of estimated vessel branch diameters, computed over three separate retinal datasets. A Kruskal-Wallis test rejected the null hypothesis that branch diameters were similarly distributed for the three vascular layers (P < 0.01).

