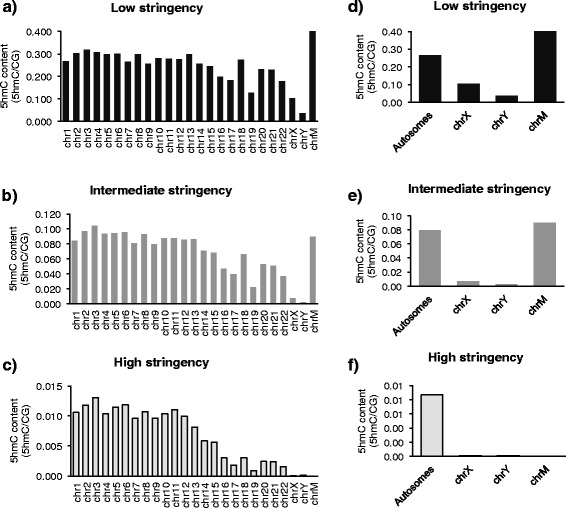
Fig. 2.

The total number of hydroxymethylated CGs per chromosome decreased exponentially with increasing stringency. Plots displaying the total number of 5hmC sites for each chromosome corrected for the total number of CGs on the respective chromosome, for low (a), intermediate (b), and high (c) stringencies. Summary plots for autosomes, sex chromosomes, and mitochondrial DNA are shown for each respective stringency (d-f)
