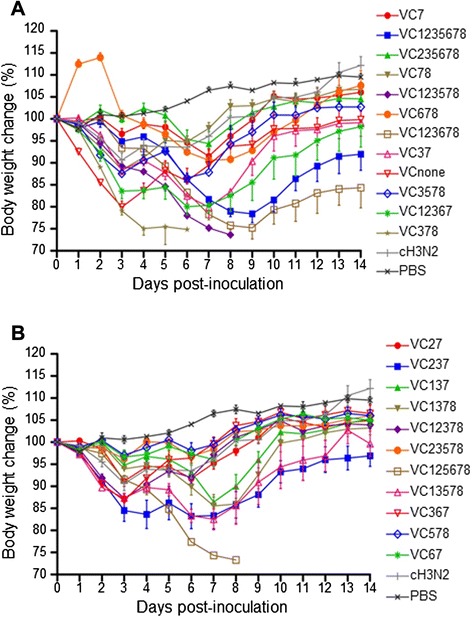
Fig. 1.

Body weight changes in mice. Mice (n = 6 per group) were inoculated intranasally with 106.5 EID50 of each virus or PBS and monitored daily for 14 days for changes in body weight. Panel a shows body weight changes of groups of mice infected with VC7, VC1235678, VC235678, VC78, VC123578, VC678, VC123678, VC37, VCnone, VC3578, VC12367 or VC378. Panel b reveals those of groups of mice infected with VC27, VC237, VC137, VC1378, VC12378, VC23578, VC125678, VC13578, VC367, VC578 or VC67. The changes are represented as the percentage of weight on the day of inoculation (day zero), and the average of each group is shown
