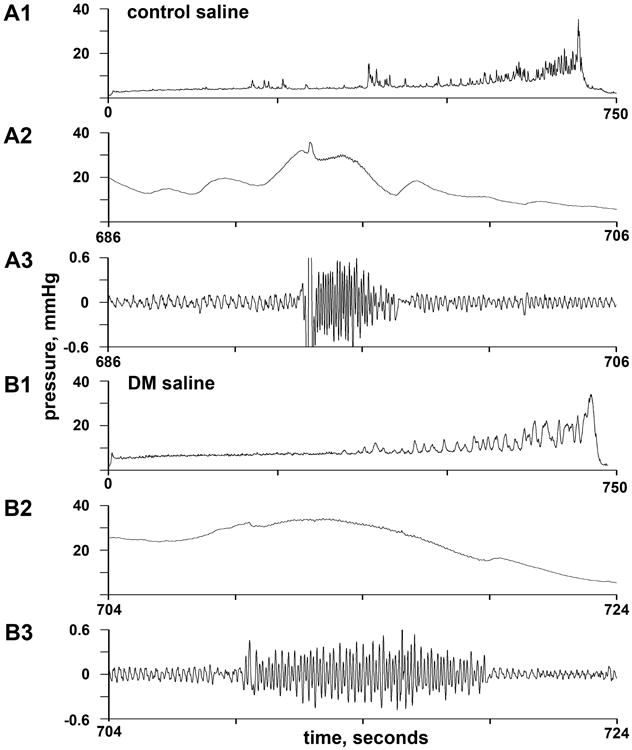
Figure 1.

Representative cystometrograms of saline-treated control (A) and diabetic (B) mice. Panels A1 and B1 show complete cystometrograms begun after emptying the bladder; although filling time was similar, the infusion rate for A was about 3 times higher than that for B. Panels A2 and B2 show the 20 seconds surrounding voiding, and panels A3 and B3 show the same data after bandpass filtering used to emphasize high-frequency oscillations attending phasic EUS contraction. DM = diabetes mellitus.
