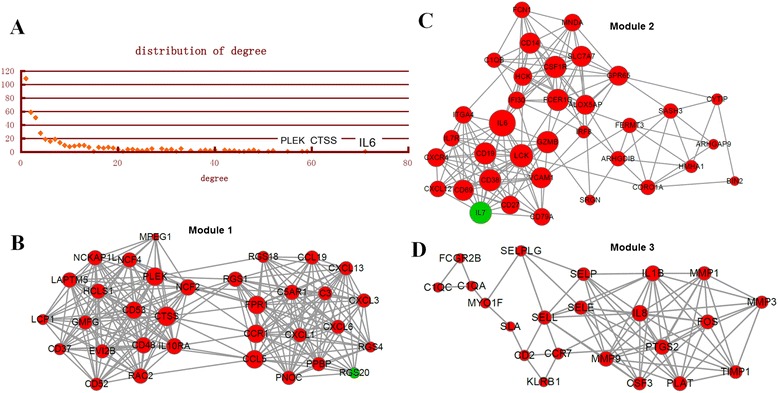
Fig. 2.

Analysis of the PPI network.A, topological analysis of the degrees of the DEGs in the PPI network. Horizontal axis stands for the degree of one DEG and vertical axis stands for the number of nodes. B, module 1 of DEGs from PPI network. C, module 2 of DEGs from PPI network. D, module 3 of DEGs from PPI network. Red nodes stand for the up-regulated DEGs while green nodes stand for the down-regulated genes. The size of one node is proportional to the degree of this gene
