
Fig. 3.
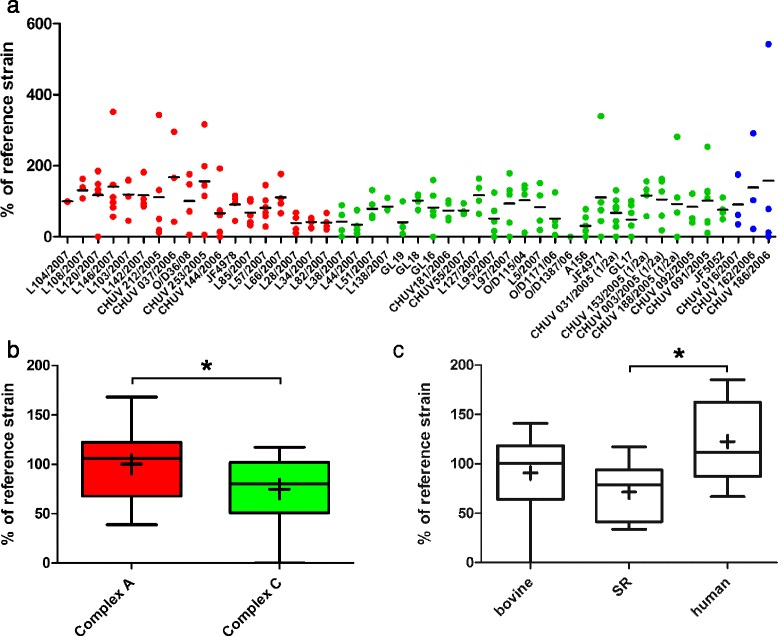
CFU counts (a) and size of infection foci (b) in organotypic brain-slices infected with L. monocytogenes strains. Results are mapped according to the source and associated clinical infection, respectively. Data are presented as box plots, Whiskers represent maxima and minima. The vertical line represents the median, + is the mean. * = p < 0.05. CFU counts (a) and surface of bacterial spread (b) are shown relative to the internal control strain L104