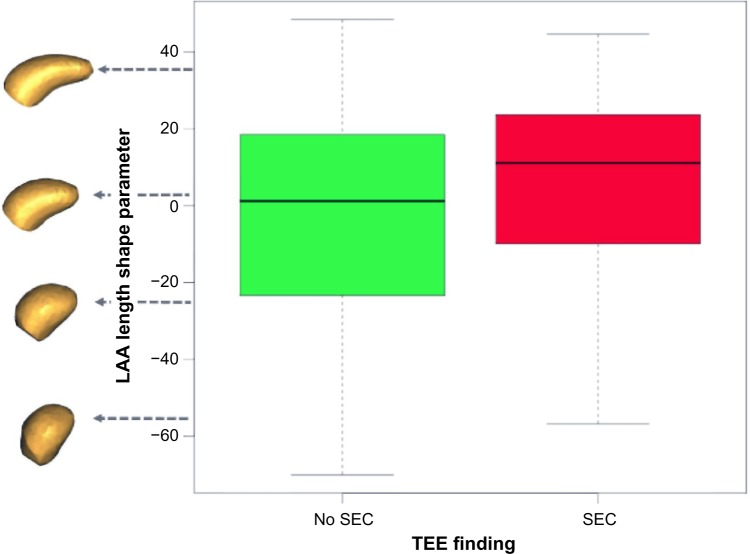
Figure 6.
The LAA length shape parameter describes significant group differences between patients where SEC is present in TEE examinations and those where no SEC is found, P = 0.028. Longer, thinner LAA shapes tend to show more SEC than shorter, thicker shapes. (Note that units are not physical units, but units of the PCA shape parameter.).

