
Figure 3. Univariate analysis of SChLAP1 in three cohorts.
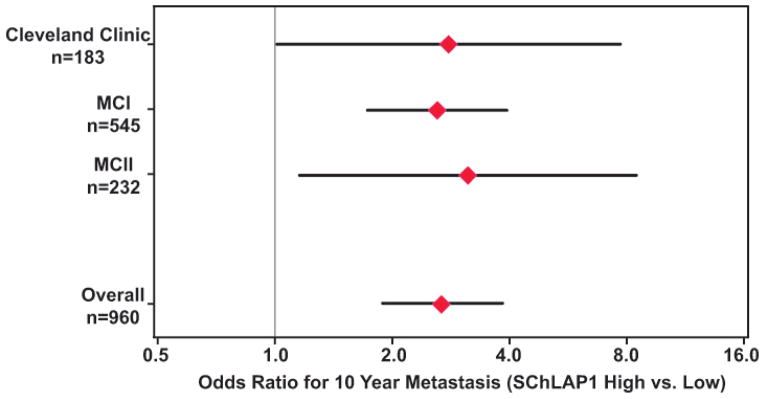
A forest plot for individual univariate analyses as well as a pooled analysis of all cohorts for metastatic progression at 10 years post-prostatectomy. The odds ratio for patient outcomes based on SChLAP1 expression is shown (red diamond, odds ratio; black bar, 95% confidence interval). For the overall odds ratio in this figure, data were calculated from a logistic regression model, p<0·0001.