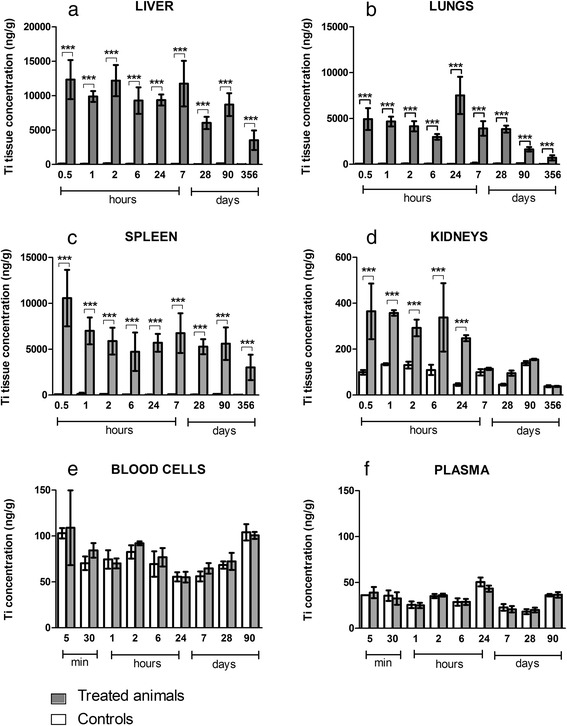
Fig. 2.

Tissue distribution of titanium after IV injection of 1 mg/kg TiO2 NPs in rats. Titanium quantification in liver (a); lungs (b); spleen (c); kidneys (d); blood cells (e) and plasma (f) of treated (grey) and control (white) animals. Quantification by inductively coupled plasma mass spectrometry (ICP-MS). Each data point represents the mean ± SD of n = 6 animals. Statistical comparison was performed by two-way ANOVA, *P < 0.05; **P < 0.01; ***P < 0.001
