Fig. 5.

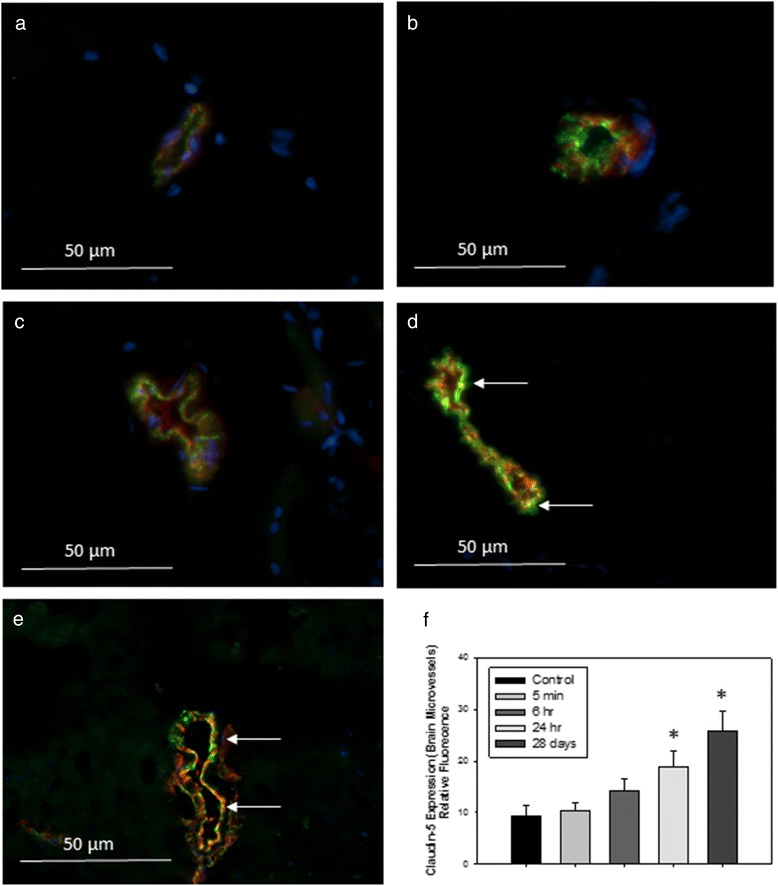
Representative images of immunofluorescence expression of tight junction protein claudin-5 (red) and endothelial cell marker vonWillebrand factor (vWF, green) in the cerebral microvasculature of (a) control rats, or tissues collected from rats treated with 1 mg/kg TiO2 (IV) at (b) 5 min; (c) 6 h; (d) 24 h or (e) 28 days post-treatment. Yellow fluorescence indicates overlay (co-localization) of claudin-5 and vWF. Arrows indicate areas of increased yellow fluorescence. Graph in (f) shows analysis of relative fluorescence of overlay images ± SD. *P < 0.050 compared to controls
