
Fig. 6.
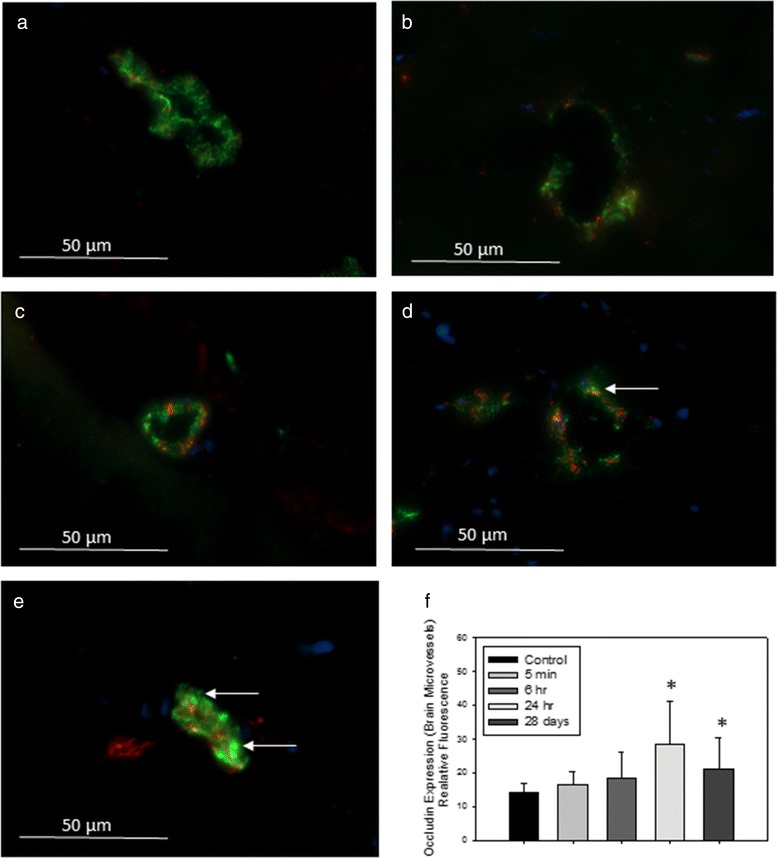
2Representative images of immunofluorescence expression of tight junction protein occludin (red) and endothelial cell marker vonWillenbrand factor (vWF, green) in the cerebral microvasculature of (a) control rats, or tissues collected from rats treated with 1 mg/kg TiO2 (IV) at (b) 5 min; (c) 6 h; (d) 24 h; or (e) 28 days post-treatment. Yellow fluorescence indicates overlay (co-localization) of occludin and vWF. Arrows indicate areas of increased yellow fluorescence. Graph in (f) shows analysis of relative fluorescence of overlay images ± SD. * P < 0.050 compared to controls