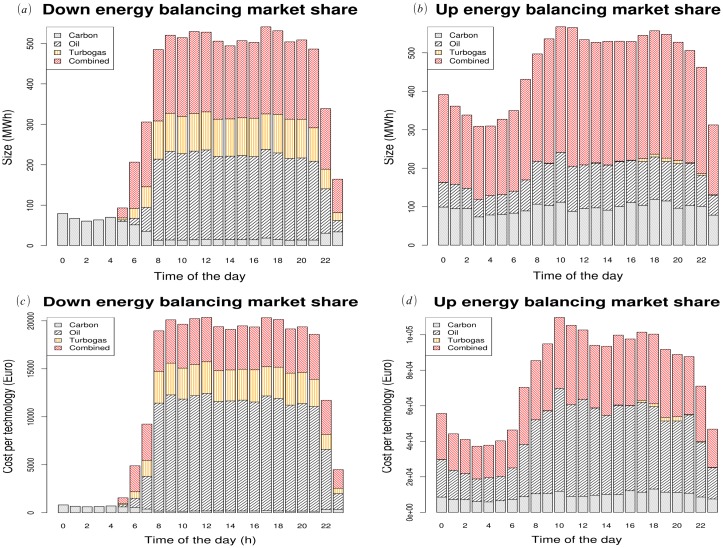
Fig 3. Estimated total energy (upper left panel (a) downward market, upper right panel (b) upward market) and total cost (bottom left panel (c) downward market, bottom right panel (d) upward market) in the balancing market.
notice that our model is able to detail the contribution of each conventional power plant technology. As expected, due to low ramping (i.e. slowness in changing operational conditions), carbon sources have a very low impact on the balancing market even if they have often the lowest costs.

