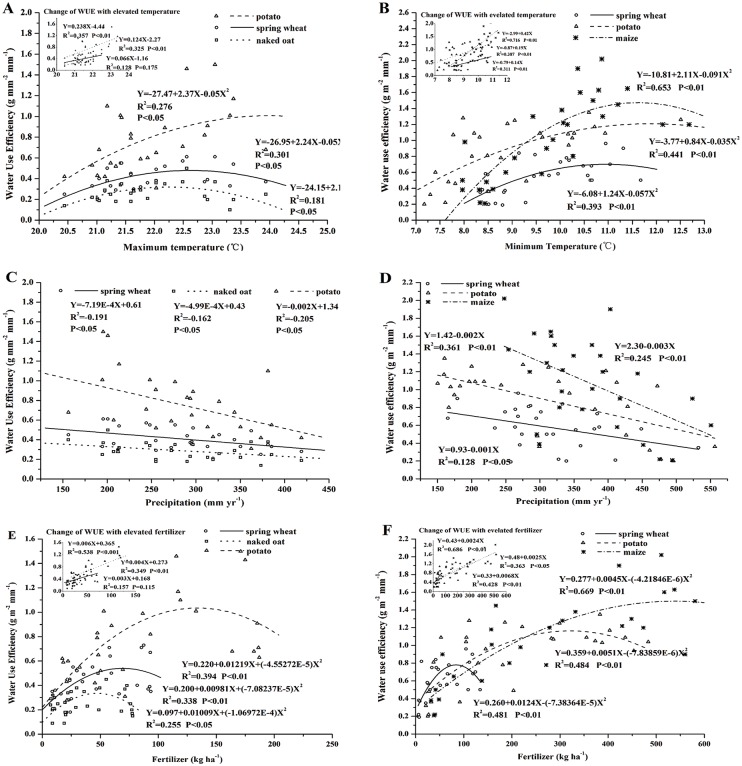
Fig 5. Relationship of crop WUE and Tmax, Tmin, precipitation, and fertilizer during 1983–2010 in the SAC.
A, C and E is the relationship of WUE and Tmax, precipitation and fertilizer in Wuchuan, respectively. B, D and Fis the relationship of WUE and Tmin, precipitation, and fertilizer in Guyuan, respectively. The insets illustrate the change of WUE with elevated temperature and fertilizer usage (within the threshold). P<0.01 represents the 1% level of significance; P<0.05 represents the 5% level of significance.

