
Fig 3. A phase transition emerges in simulations of the endothermic individuals model.
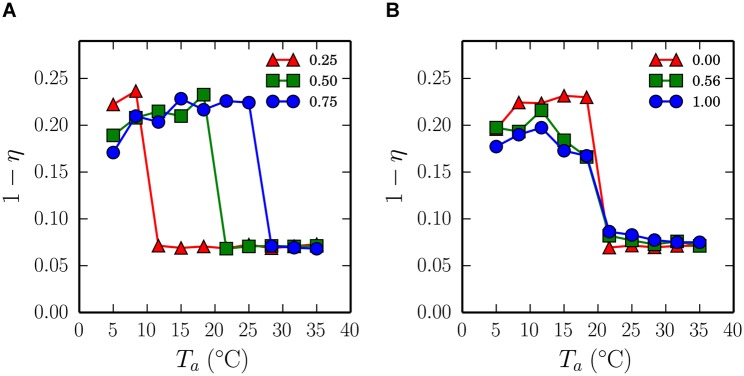
Simulation of the experiment of [9], in which each pup simply turns in the direction of heat sources. The ordinate axis represents the mean proportion of pups’ body surfaces that are in contact with another pup, (1 − η) averaged across pups and time-steps within a simulation and across 10 repeated experiments with random initial conditions. (A) The critical temperature of the phase transition can be increased by arbitrarily scaling the temperature registered at each point of the pup body surface to be 0.25, 0.5, and 0.75 of the ambient temperature (legend denotes scaling factor). (B) With the temperature scaling set to 0.5, the slope of the phase transition can be smoothed to better match the form of the experimental data presented in Fig 1, by adding normally distributed noise to the temperature sensed at each point on the pup body, with variances 0.0, 0.56 and 1°C (indicated by the legend) increasing the smoothness of the transition. Tuning the endothermic model in this way can give a reasonable match to the experimental data but it generates qualitatively poor huddling, as explained in the main text.