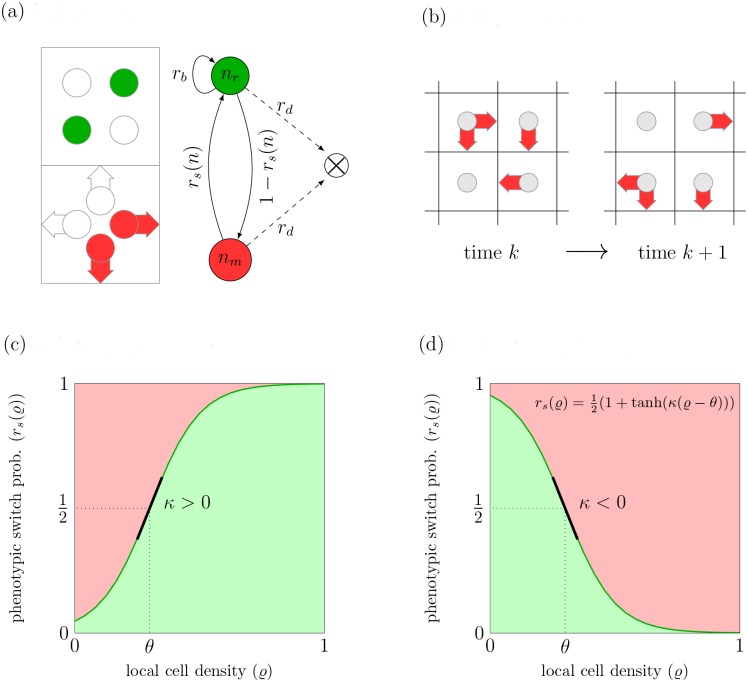
Fig 1. Cellular automaton model dynamics arise from repeated application of cell reactions and cell migration.
(a) (left) Local state space at a given node is divided into rest channels and velocity channels. The cells in the rest channels, marked in green, are of proliferative phenotype. The cells in the velocity channels, marked in red, have the migratory phenotype. White channels denote absence of tumor cells. (right) Schematic illustration of model reactions. (b) Example of application of the cell propagation operator in the CA model. Cells in the velocity channels before and after a propagation step; red arrows denote the presence of a cell in the respective velocity channel. (c) and (d) Phenotypic plasticity in the CA model. Schematic illustration of the phenotypic switch probability r s which depends on the cell density ϱ in the microenvironment. The sign of the phenotypic switch parameter κ determines the dynamic regime, κ > 0 results in attractive behavior (c) while repulsive behavior arises for κ < 0 (d).

