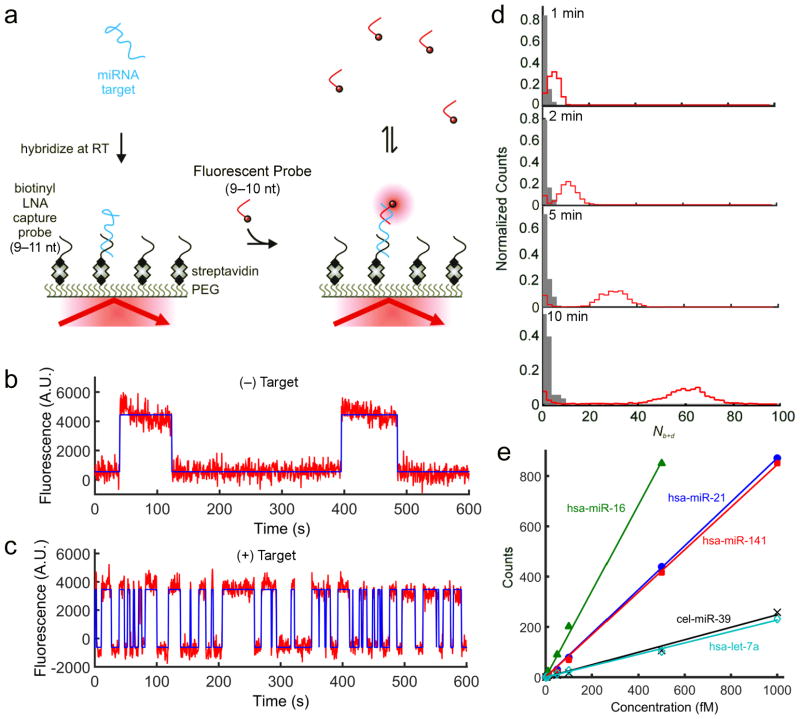
Figure 1. High-confidence detection of miRNAs with SiMREPS.
a, Experimental approach of SiMREPS detection of miRNAs. An immobilized miRNA target is identified by fluorescence microscopy as the site of repeated transient binding by short fluorescent DNA probes. b,c, Binding of probes to the slide surface (b) exhibits kinetic behavior distinct from that of binding to a target molecule (c) (red curve = fluorescence intensity, blue curve = idealization from hidden Markov modeling). d, Histograms of the number of candidate molecules showing a given number of intensity transitions (Nb+d) in the absence (gray) or presence (red) of 1 pM miR-141 with varying acquisition time. e, Standard curves from SiMREPS assays of five miRNAs. Linear fits were constrained to a y-intercept of 0, yielding R2 values > 0.99.

