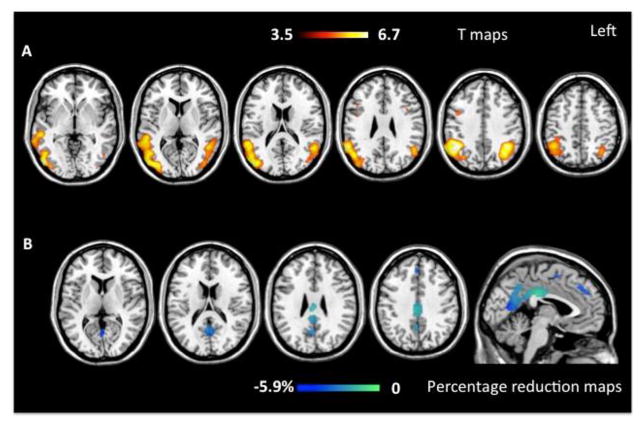
Figure 1.
The figure shows grey matter (GM) atrophy at baseline (on the top; p< 0.05 FWE) and atrophy progression after one year (at the bottom) in early onset (EOAD) Alzheimer’s disease patients compared with matched healthy controls. Results are displayed on the Montreal Neurological Institute (MNI) template available on MRIcron software (http://www.mccauslandcenter.sc.edu/mricro/mricron/). Color bars denote T values (on the top) and percentage of GM reduction during follow up (at the bottom).

